Water Testing with PACs
/Teacher Matt Jackson has mastered the art of directing his 7th grade students through five water-testing stations. The lesson begins the night before with a homework assignment asking students to read through and paraphrase why we test water features; and what can temperature, turbidity, levels of ammonia, nitrates, dissolved oxygen, and salinity tell us about the health of our creeks and tidal slough. Each student independently reads and explains the significance of each water element tested. By asking students to become familiar with the purpose of each test, when they begin testing the following day they have context and understand the value of their results.

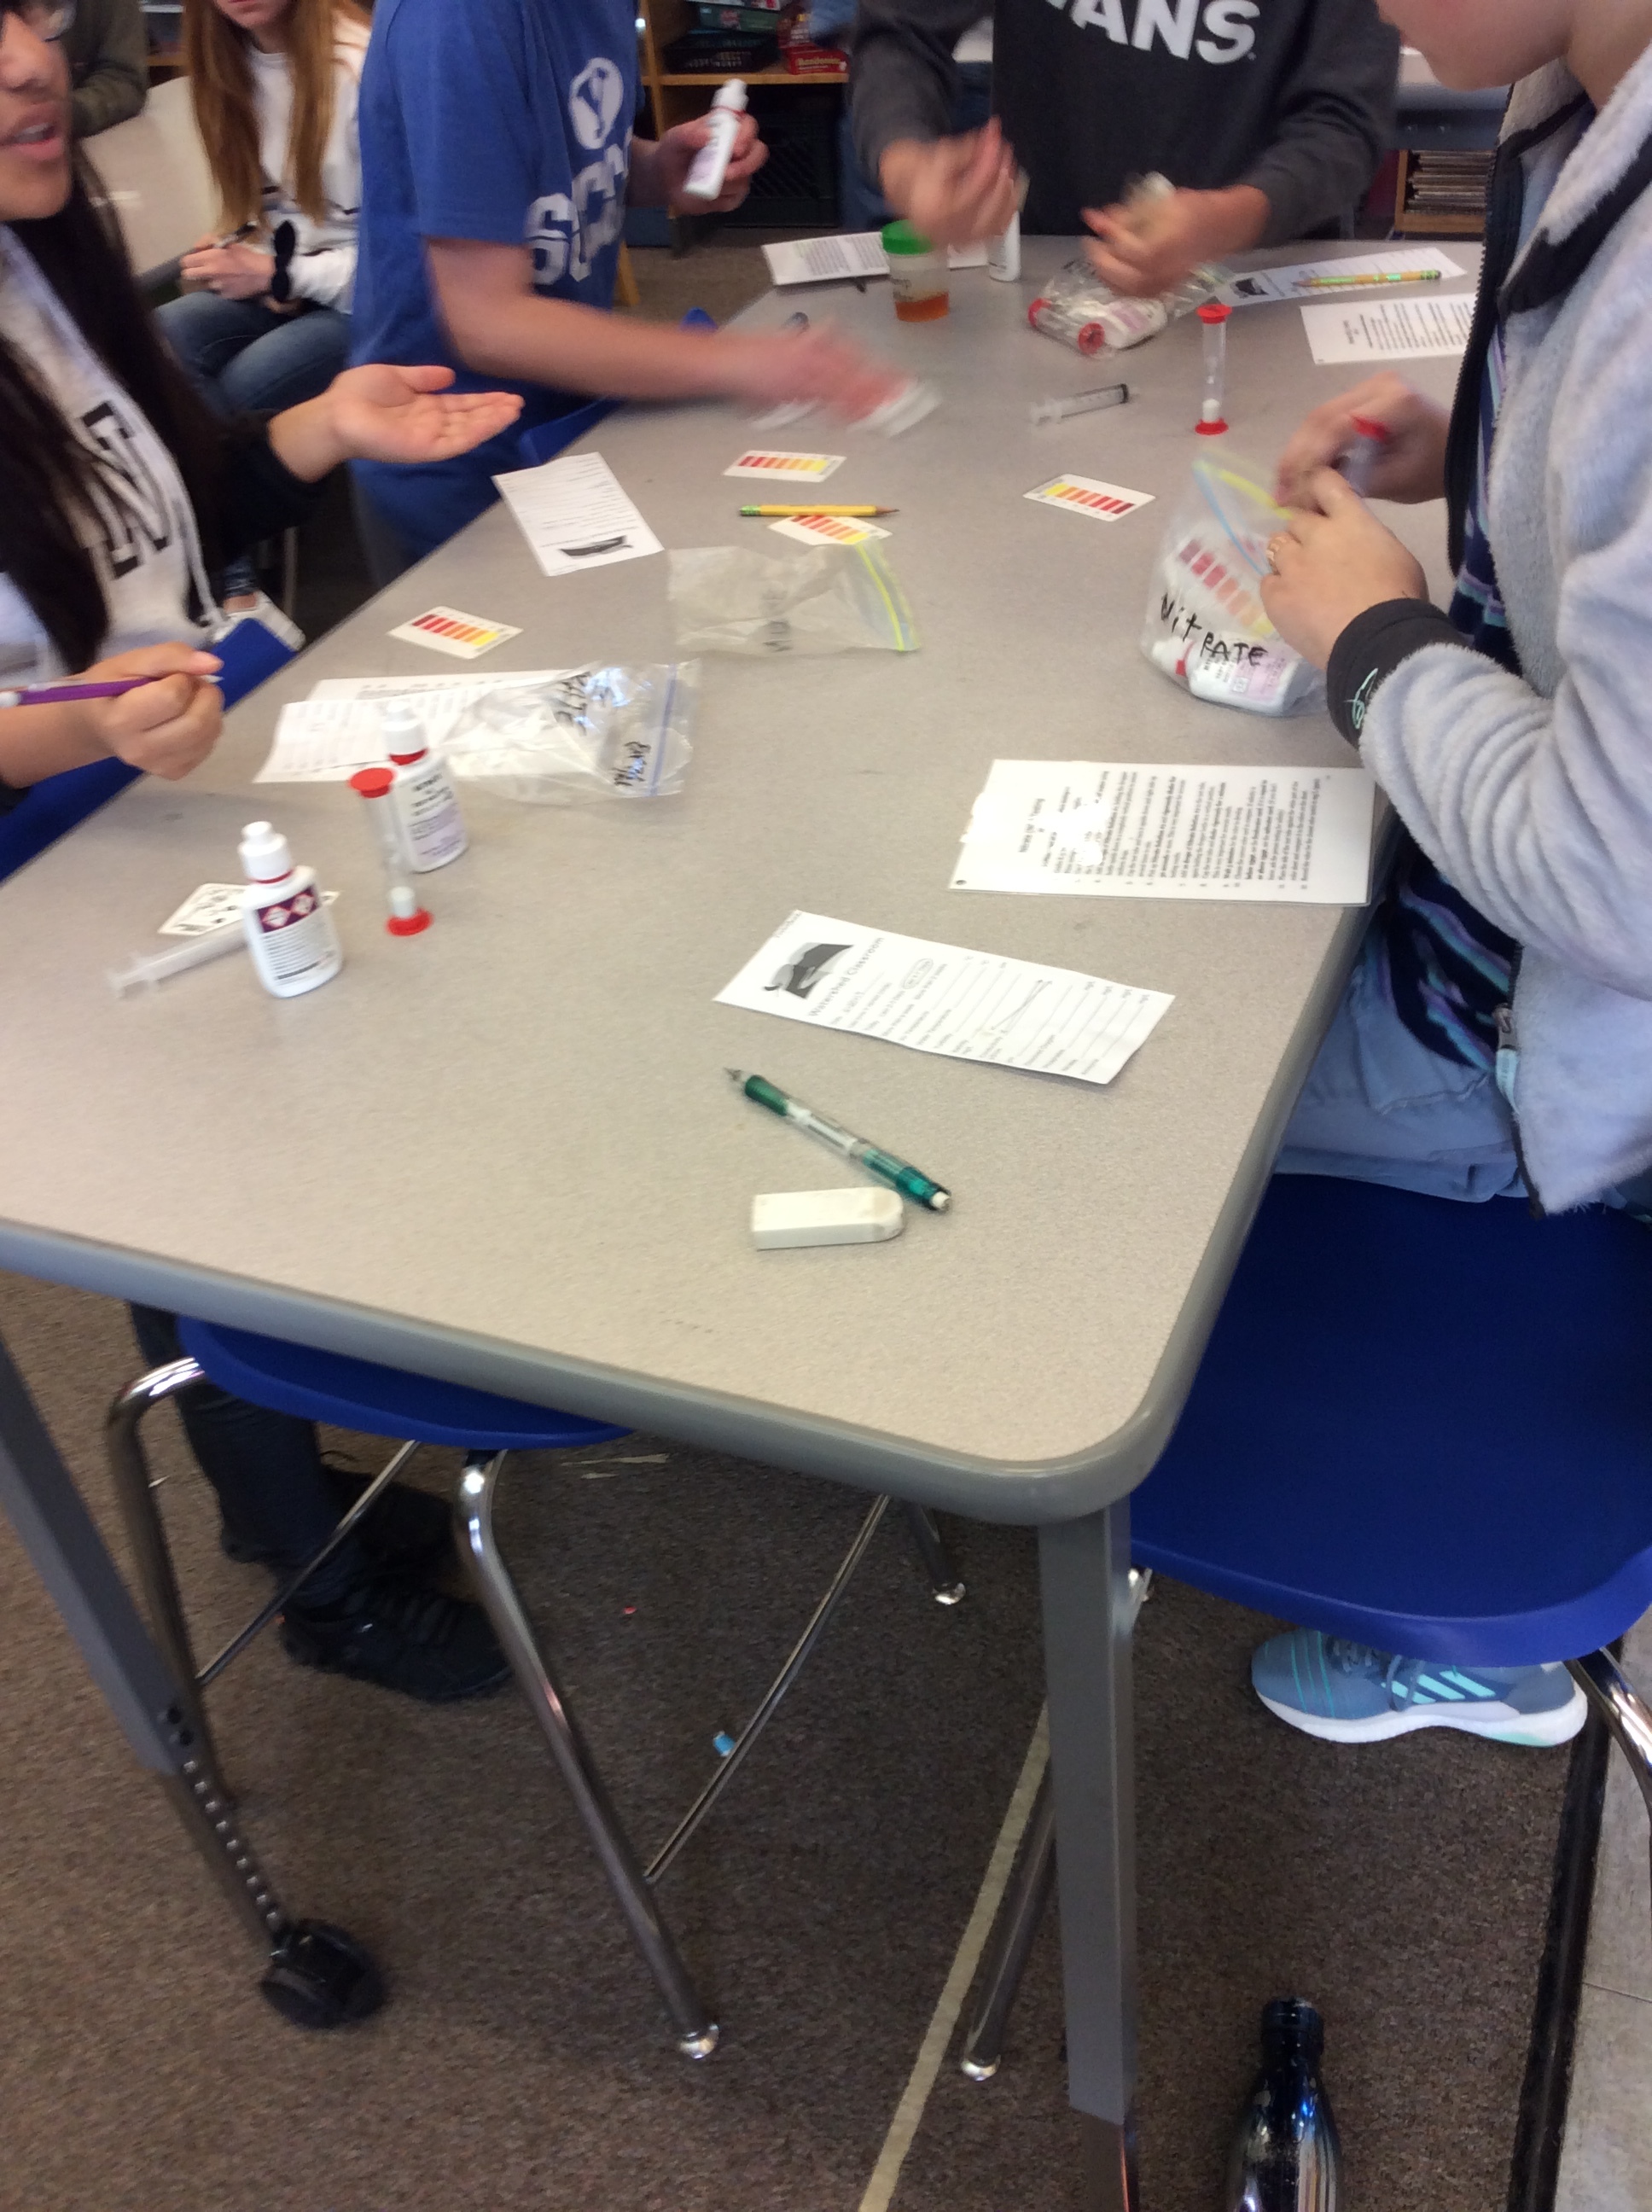
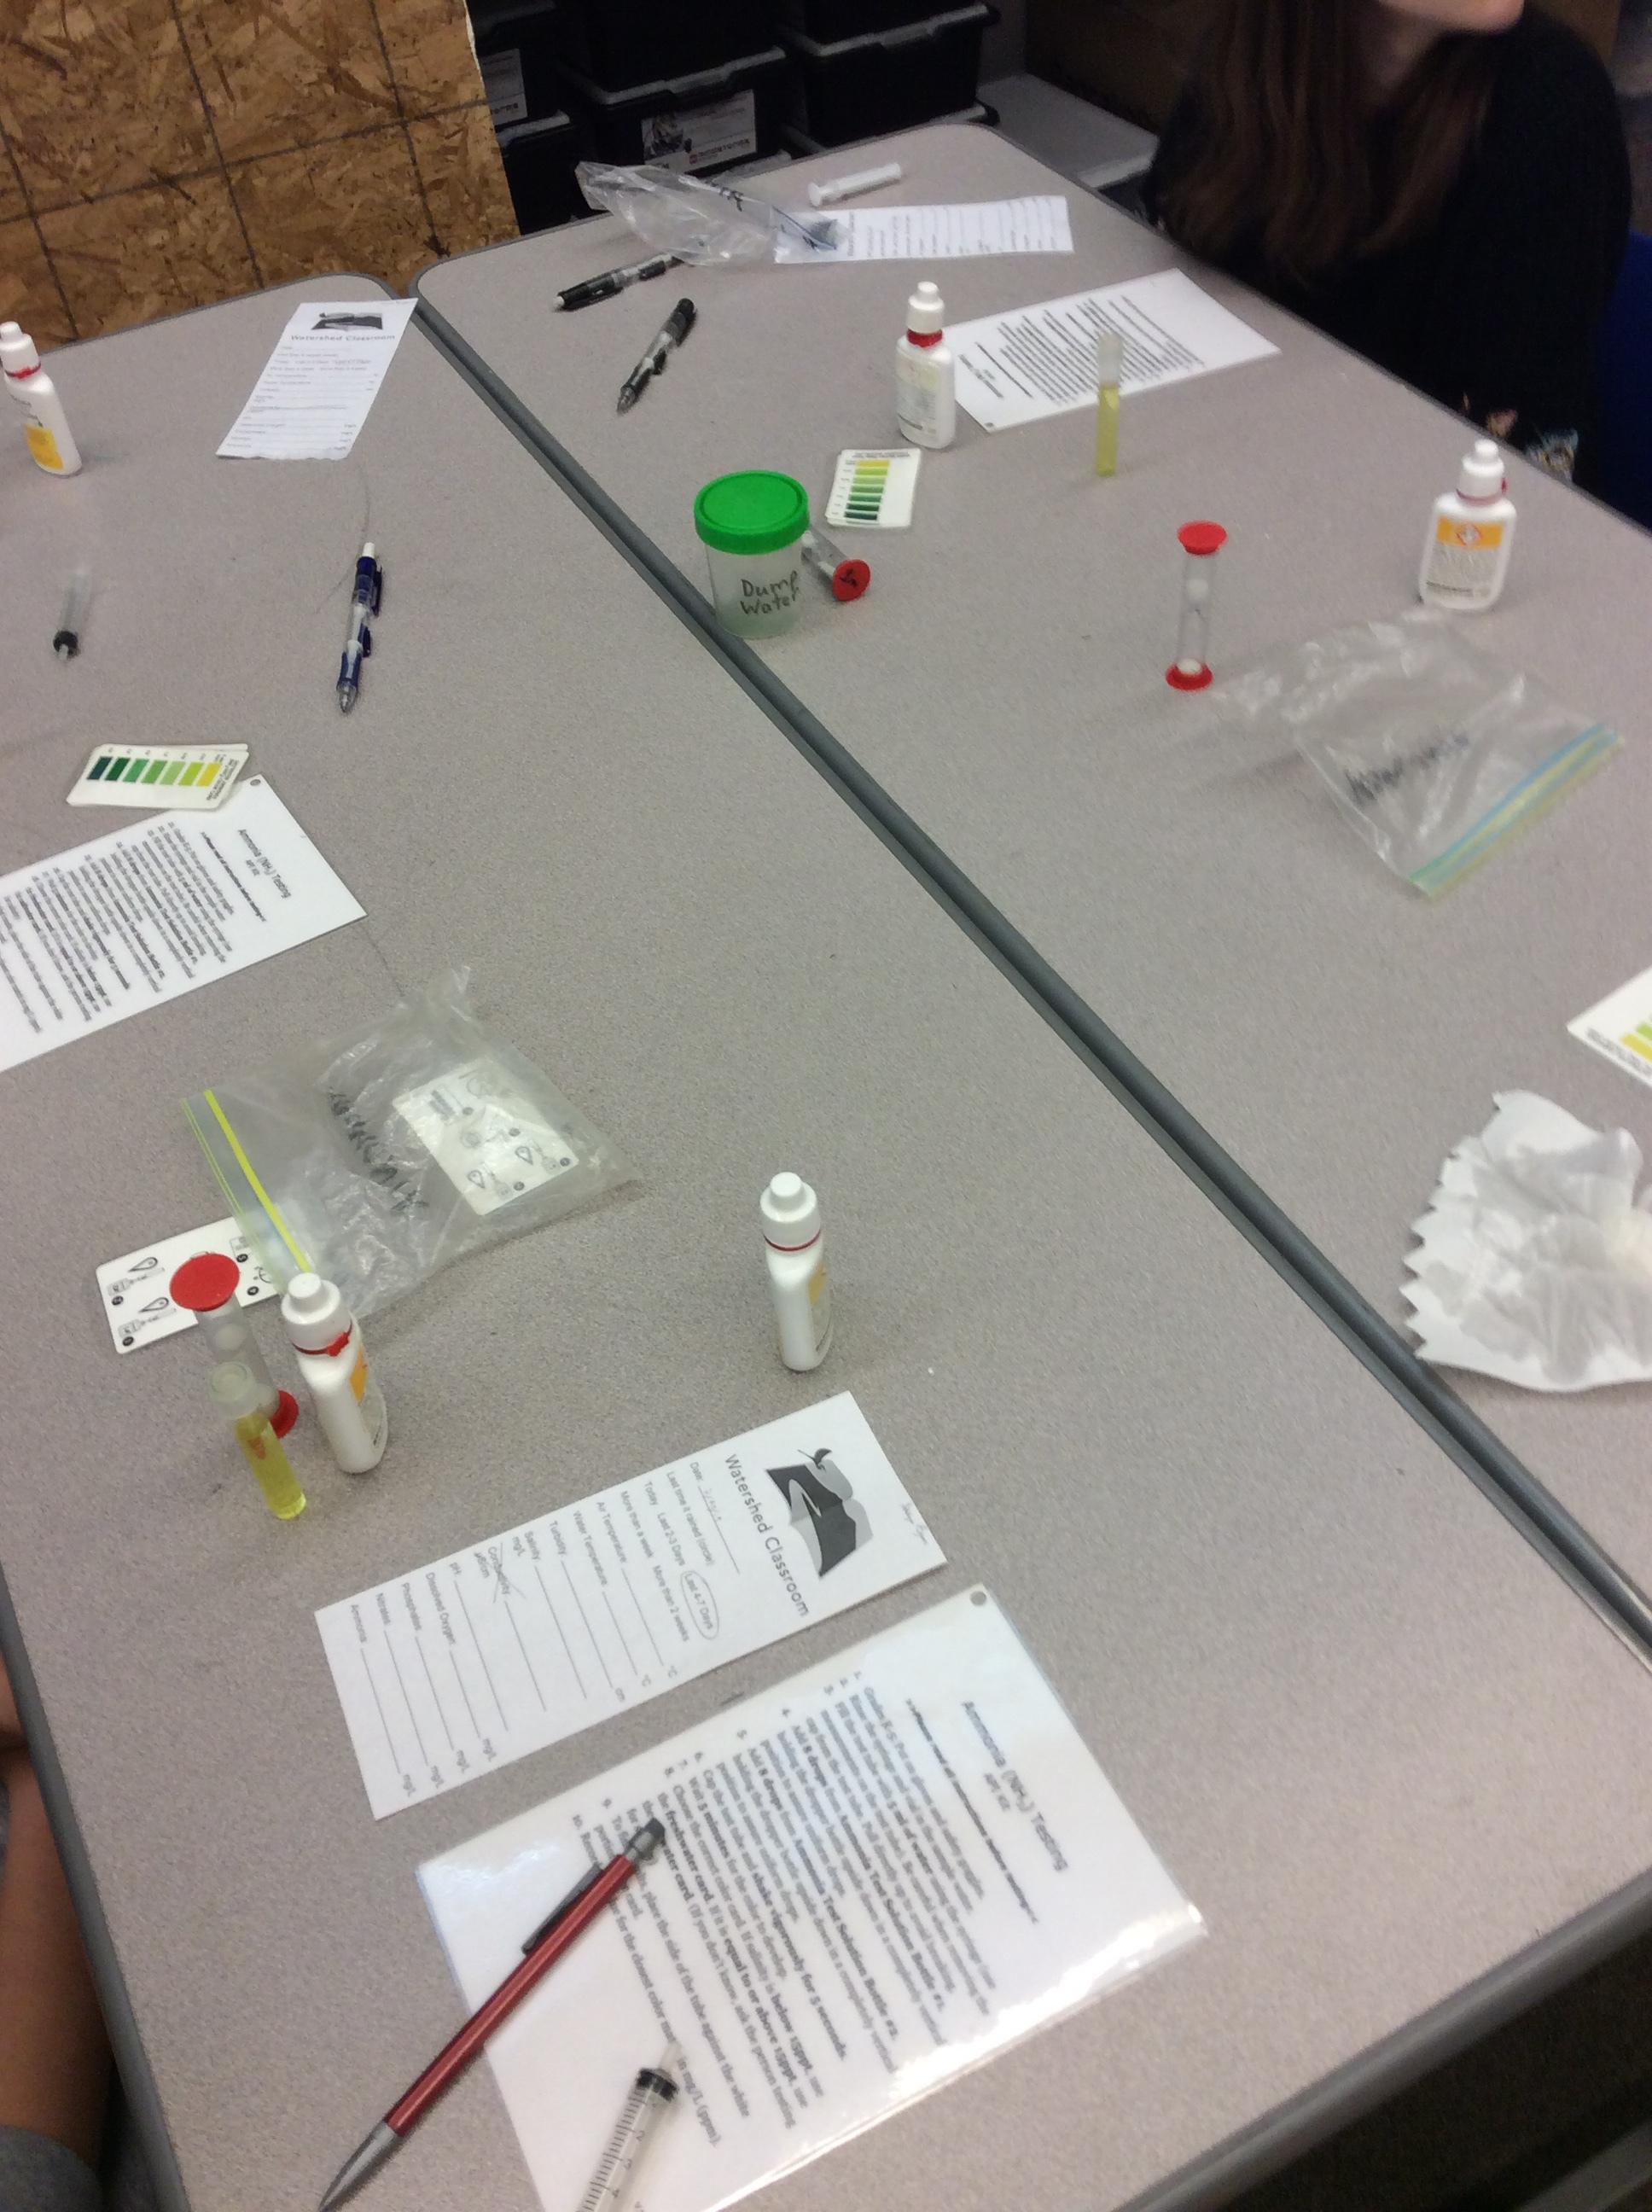
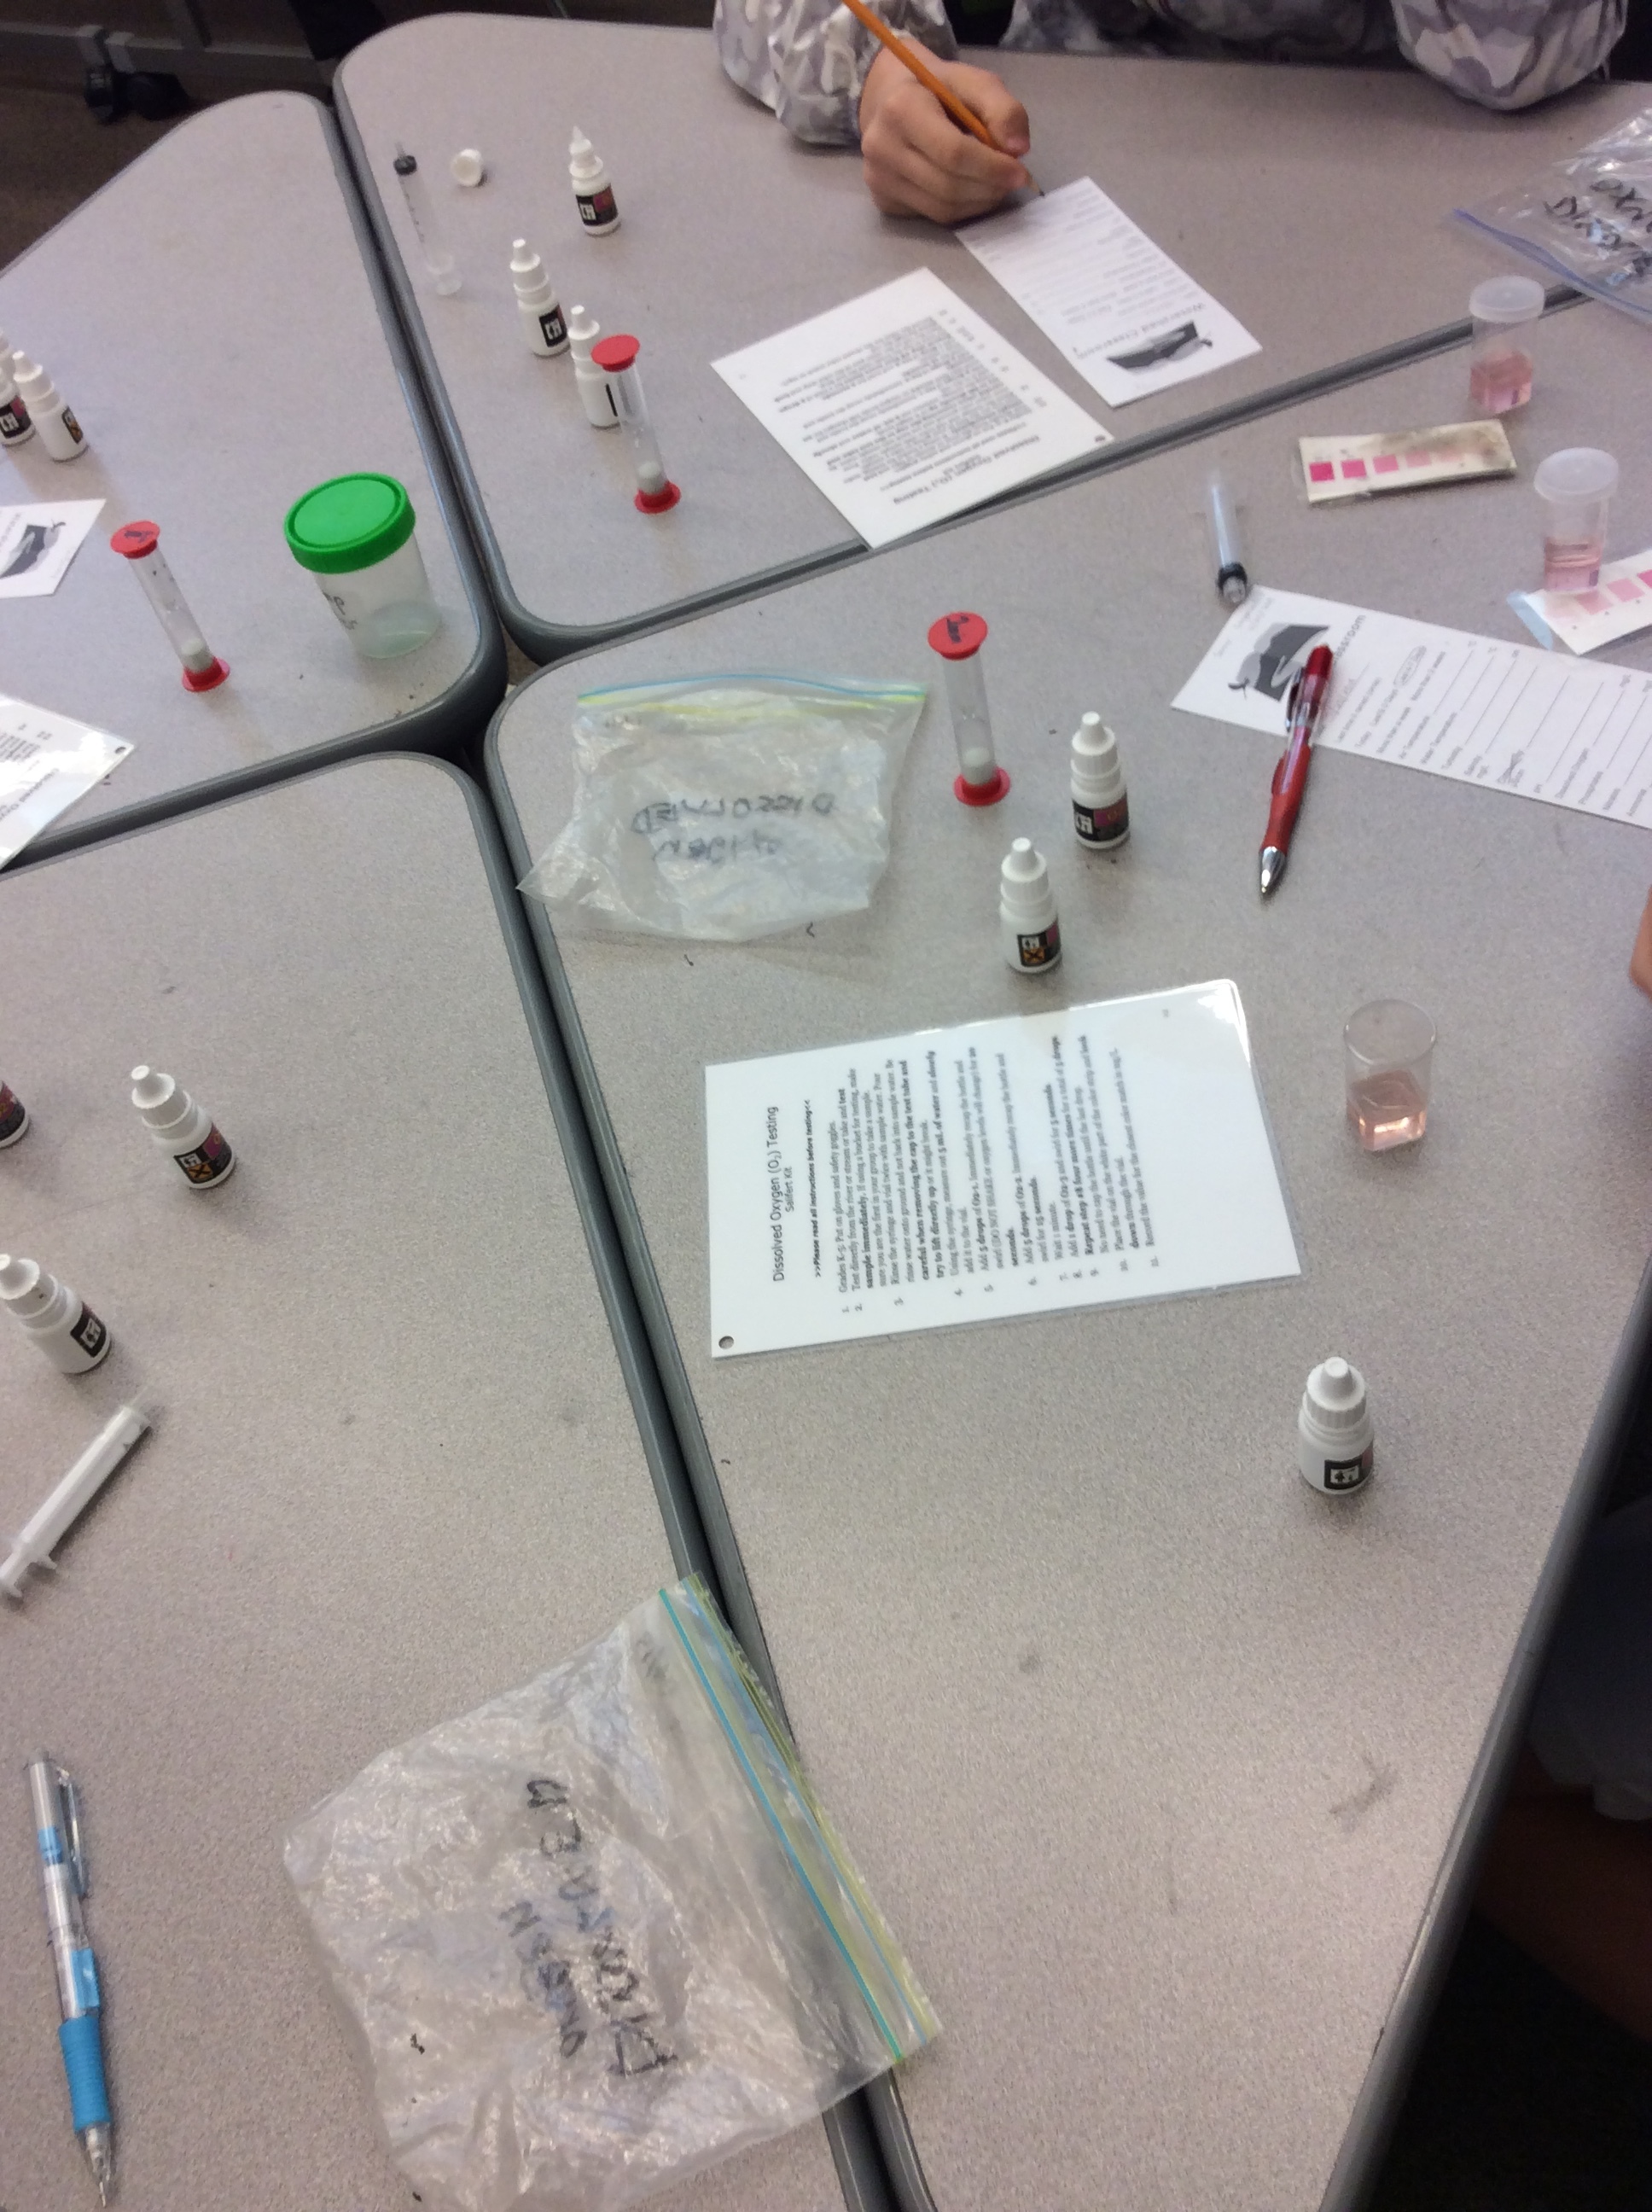
The following morning students filter into the classroom where their tables have been set up as testing stations. Each station has materials for four students to test one feature of the water. Mr. Jackson has collected two buckets of water from nearby Lynch creek, and they now sit filled in the front of the class. He instructs the students that they will be rotating, with their table group, through five testing stations. Because testing salinity and temperature are quick, students complete those tests at one station. The students testing the ammonia level dictate the timing of the rotations, as the test requires a five-minute wait.
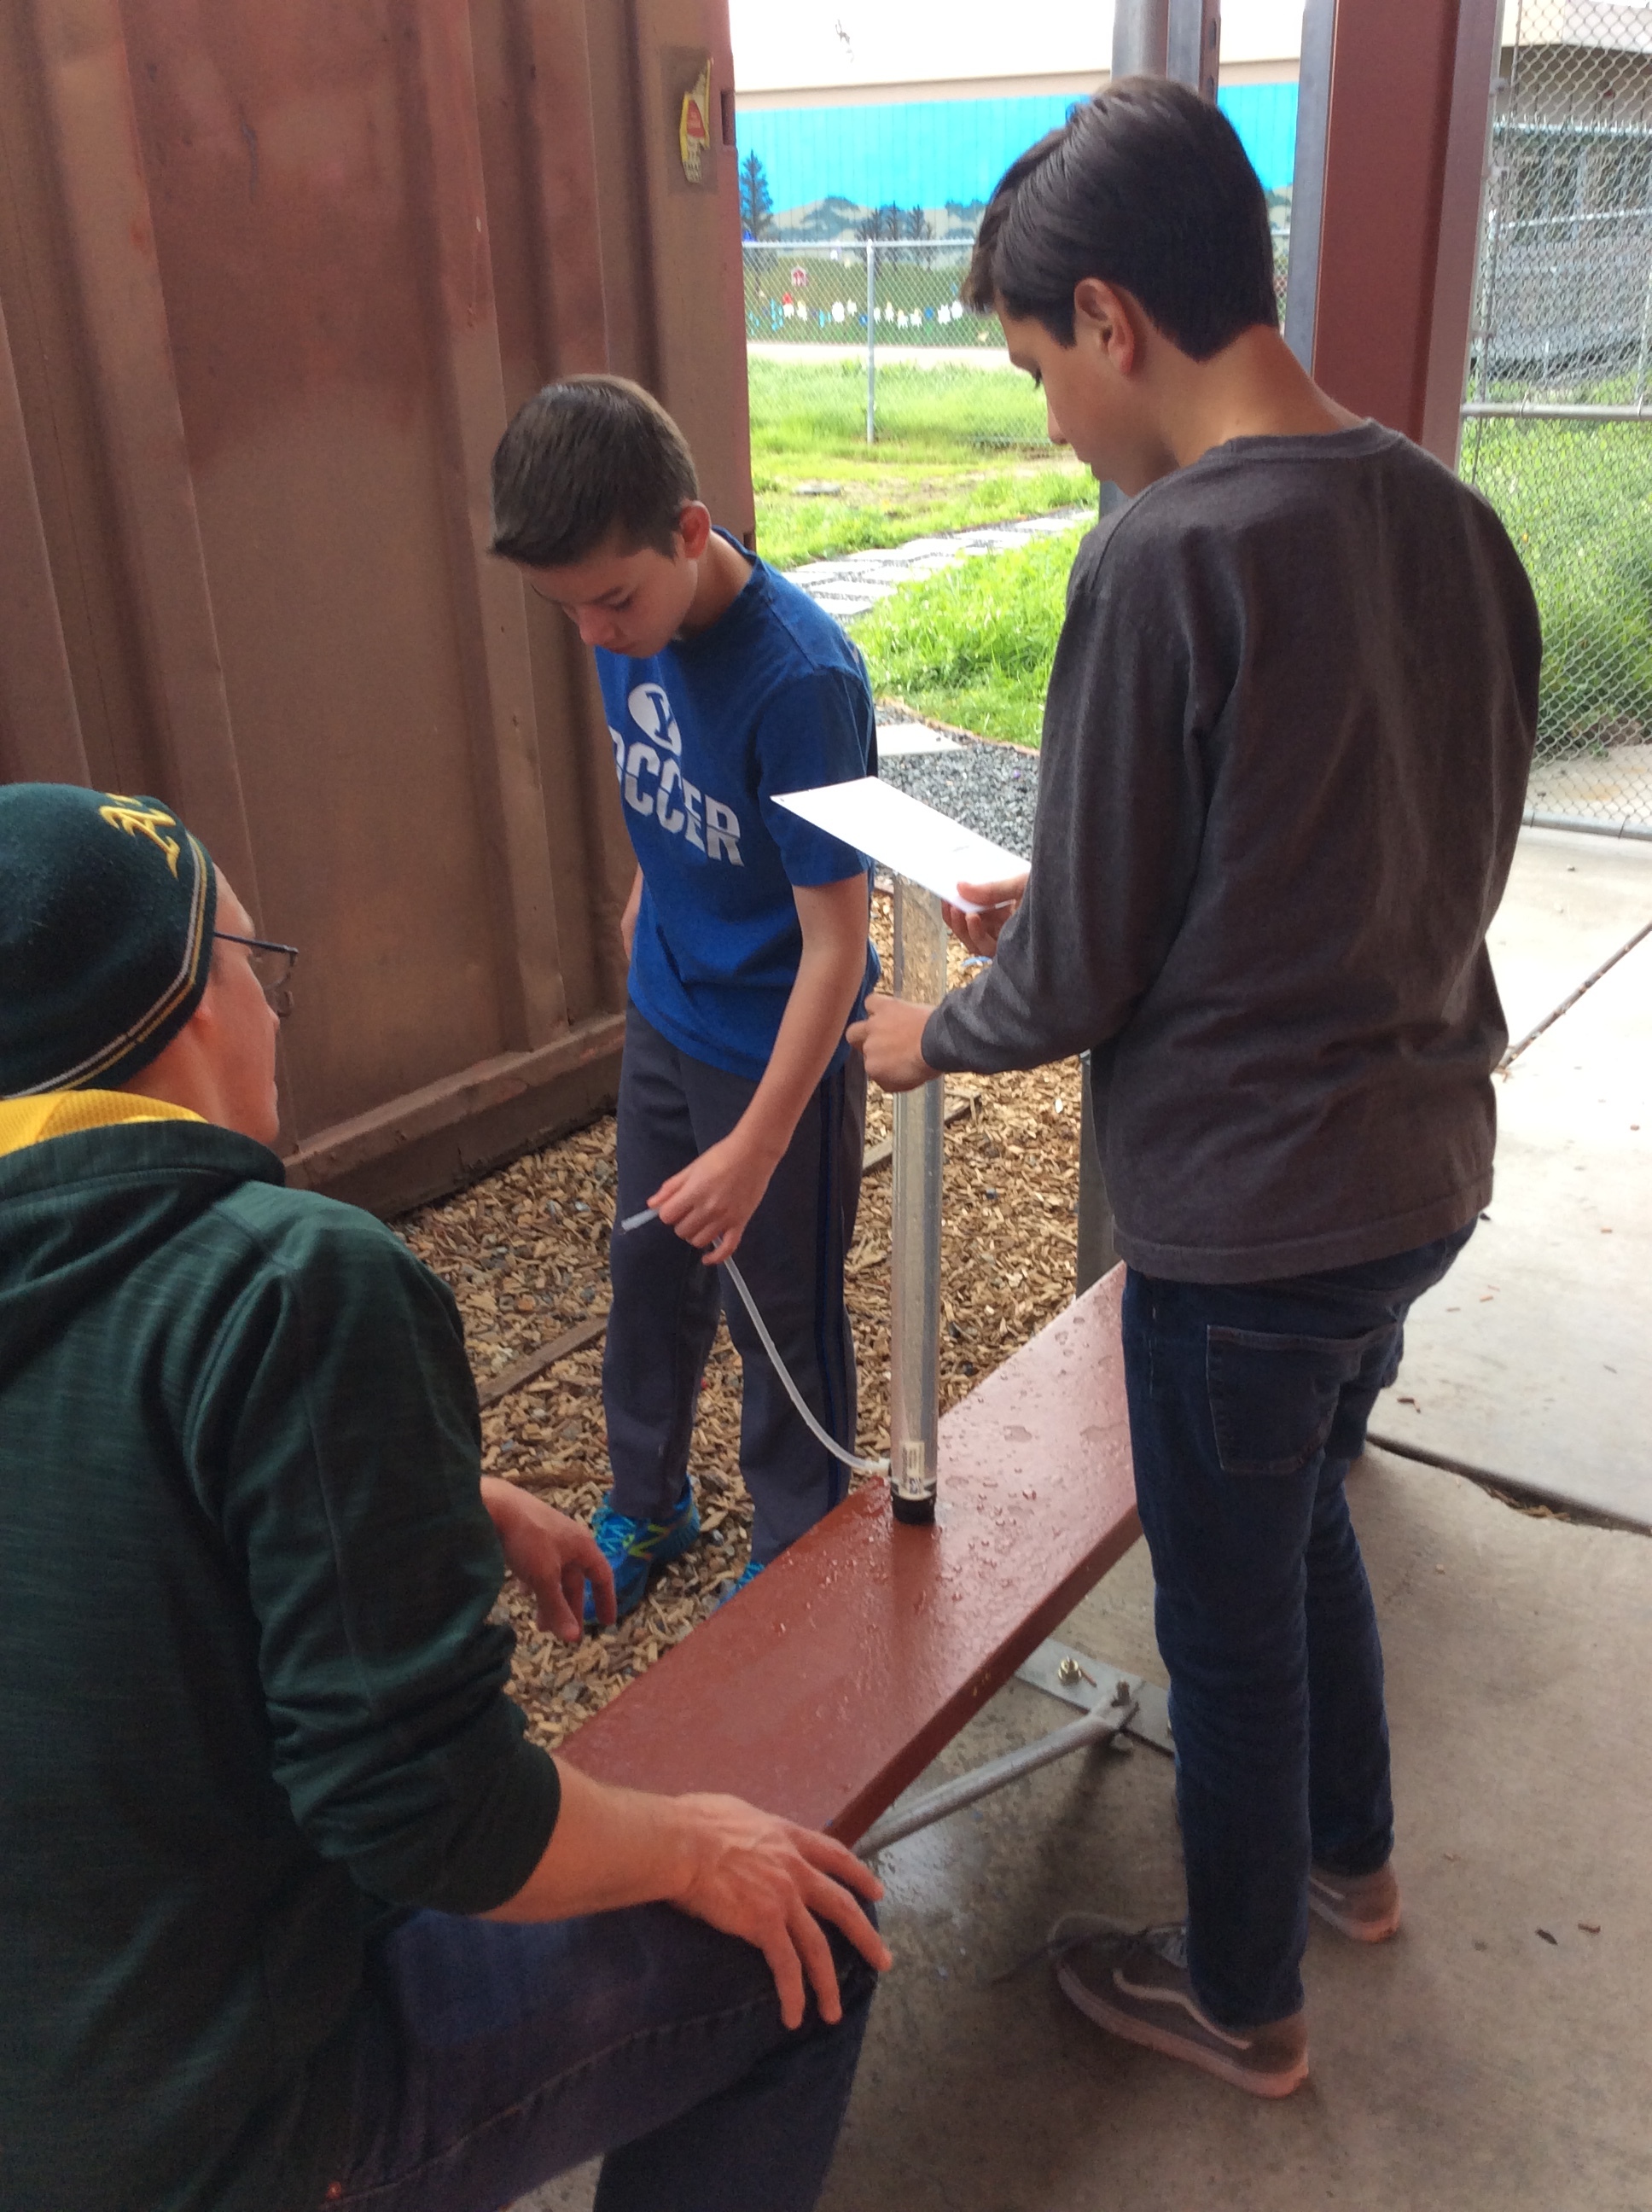
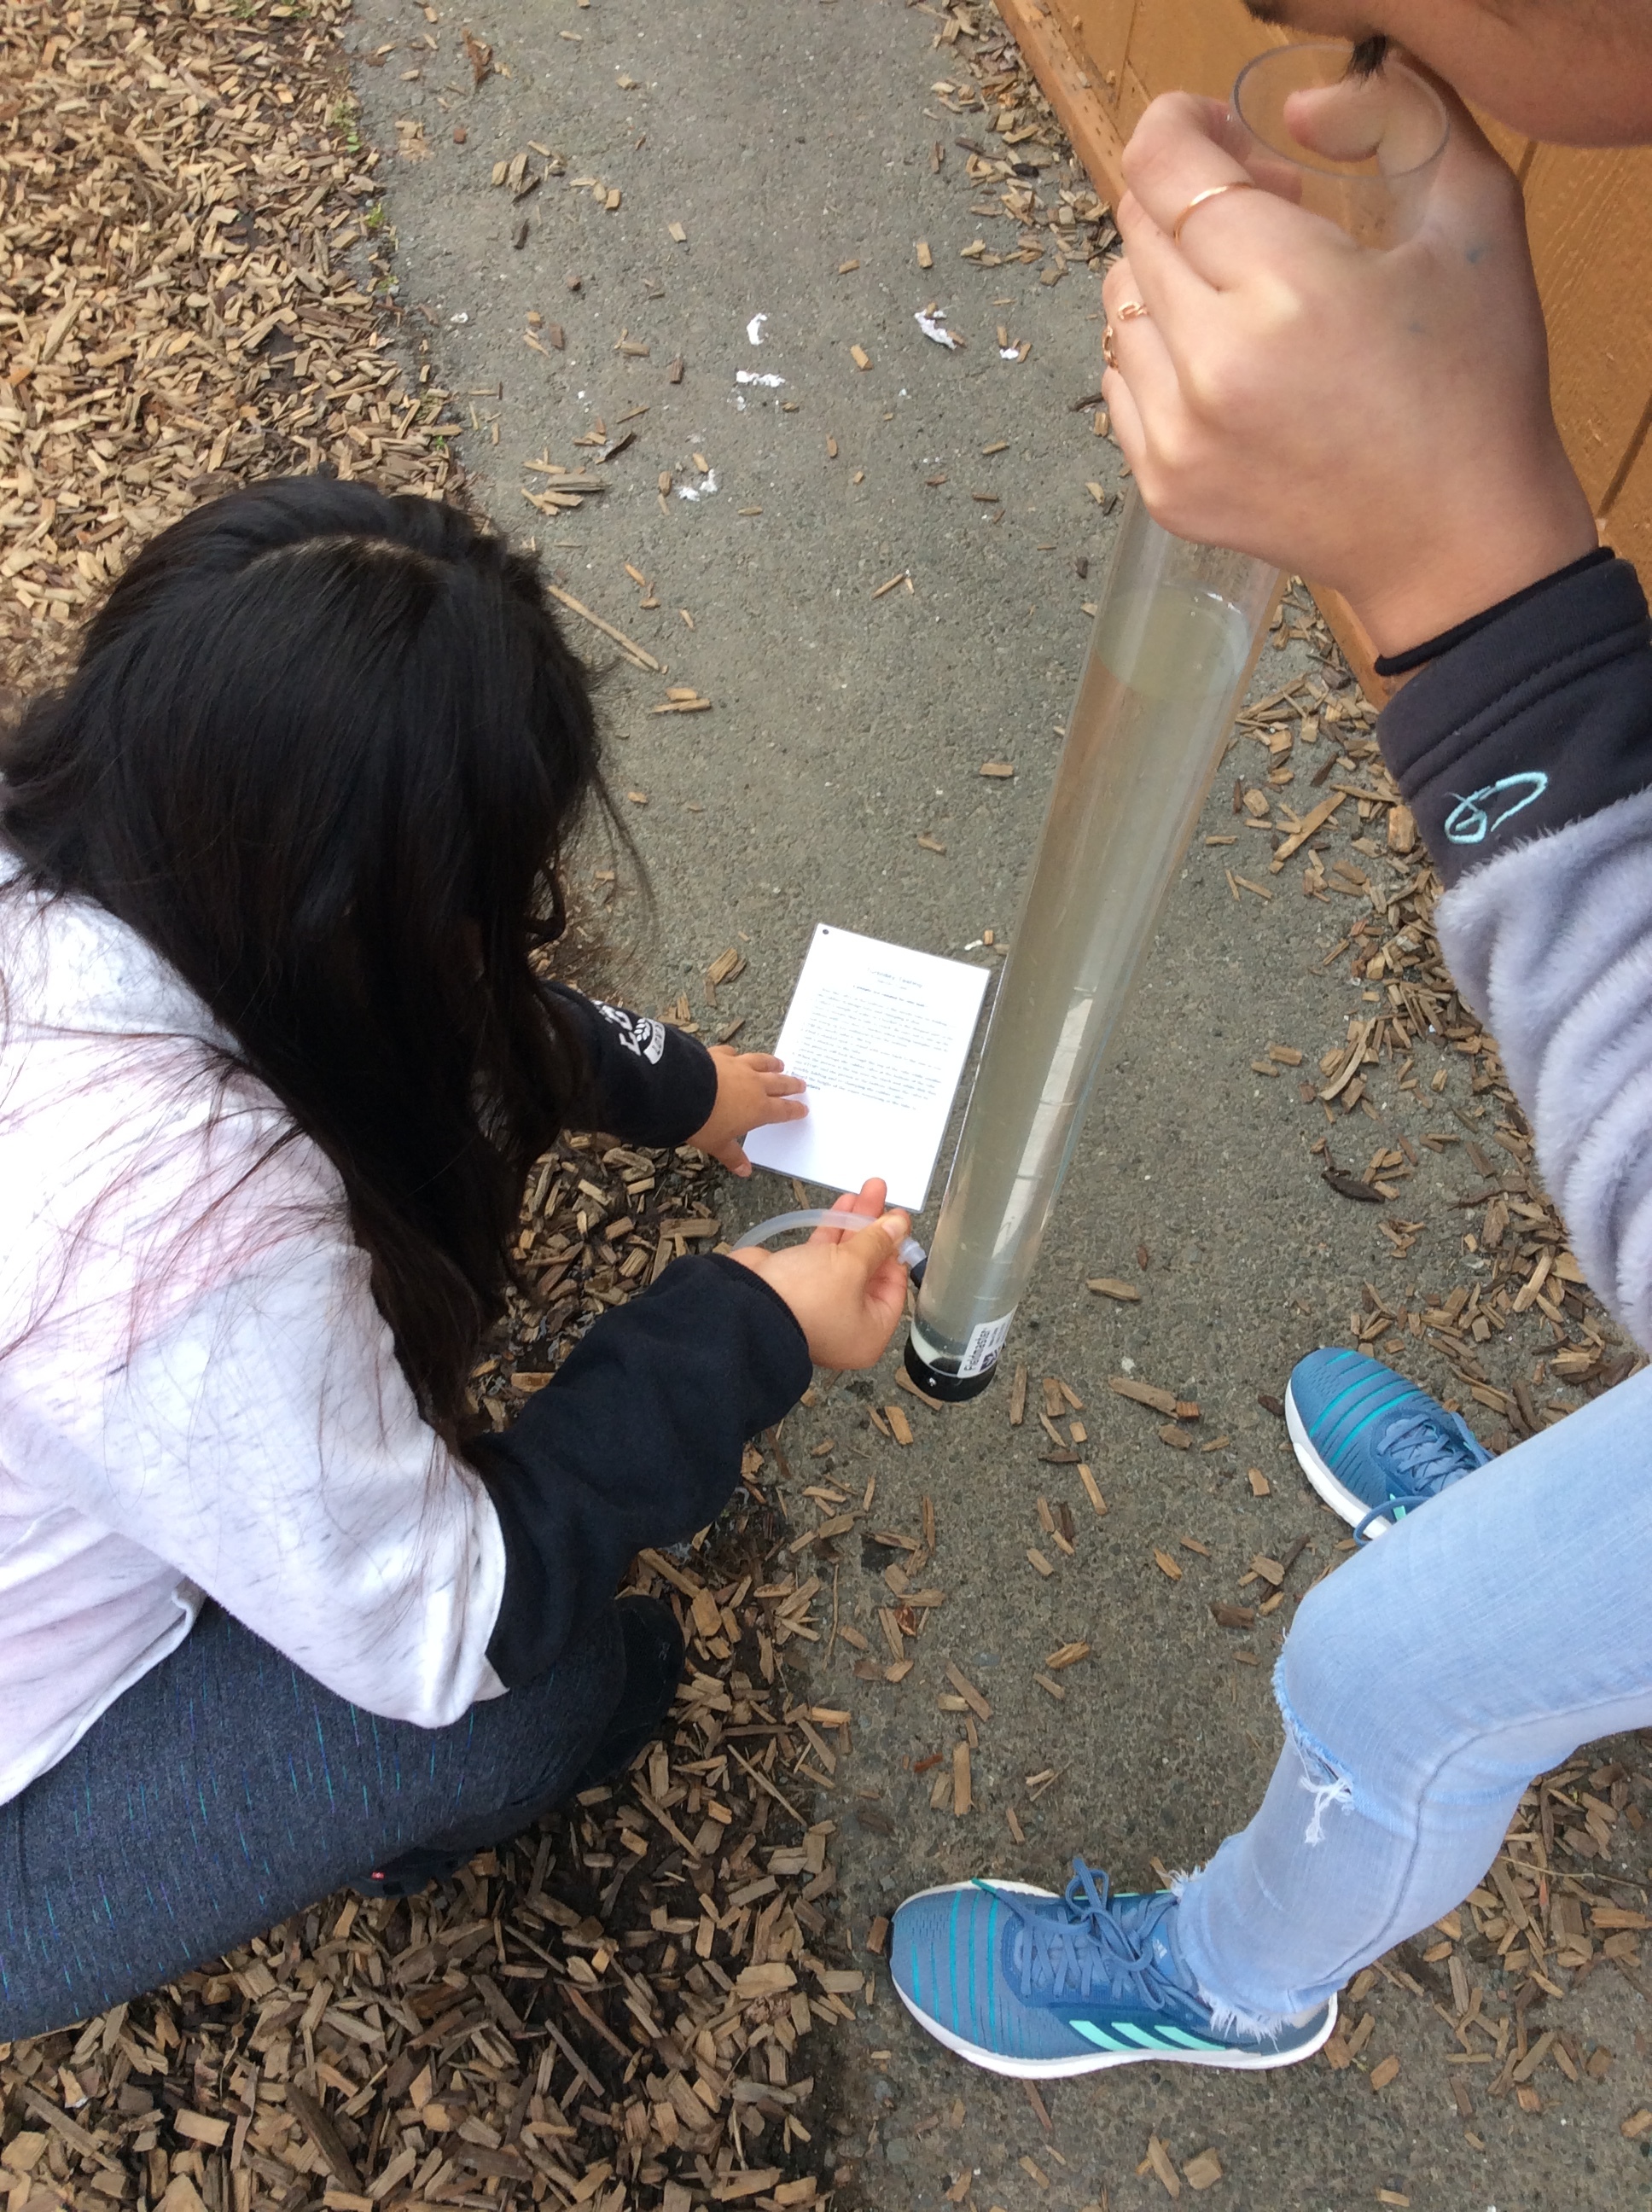
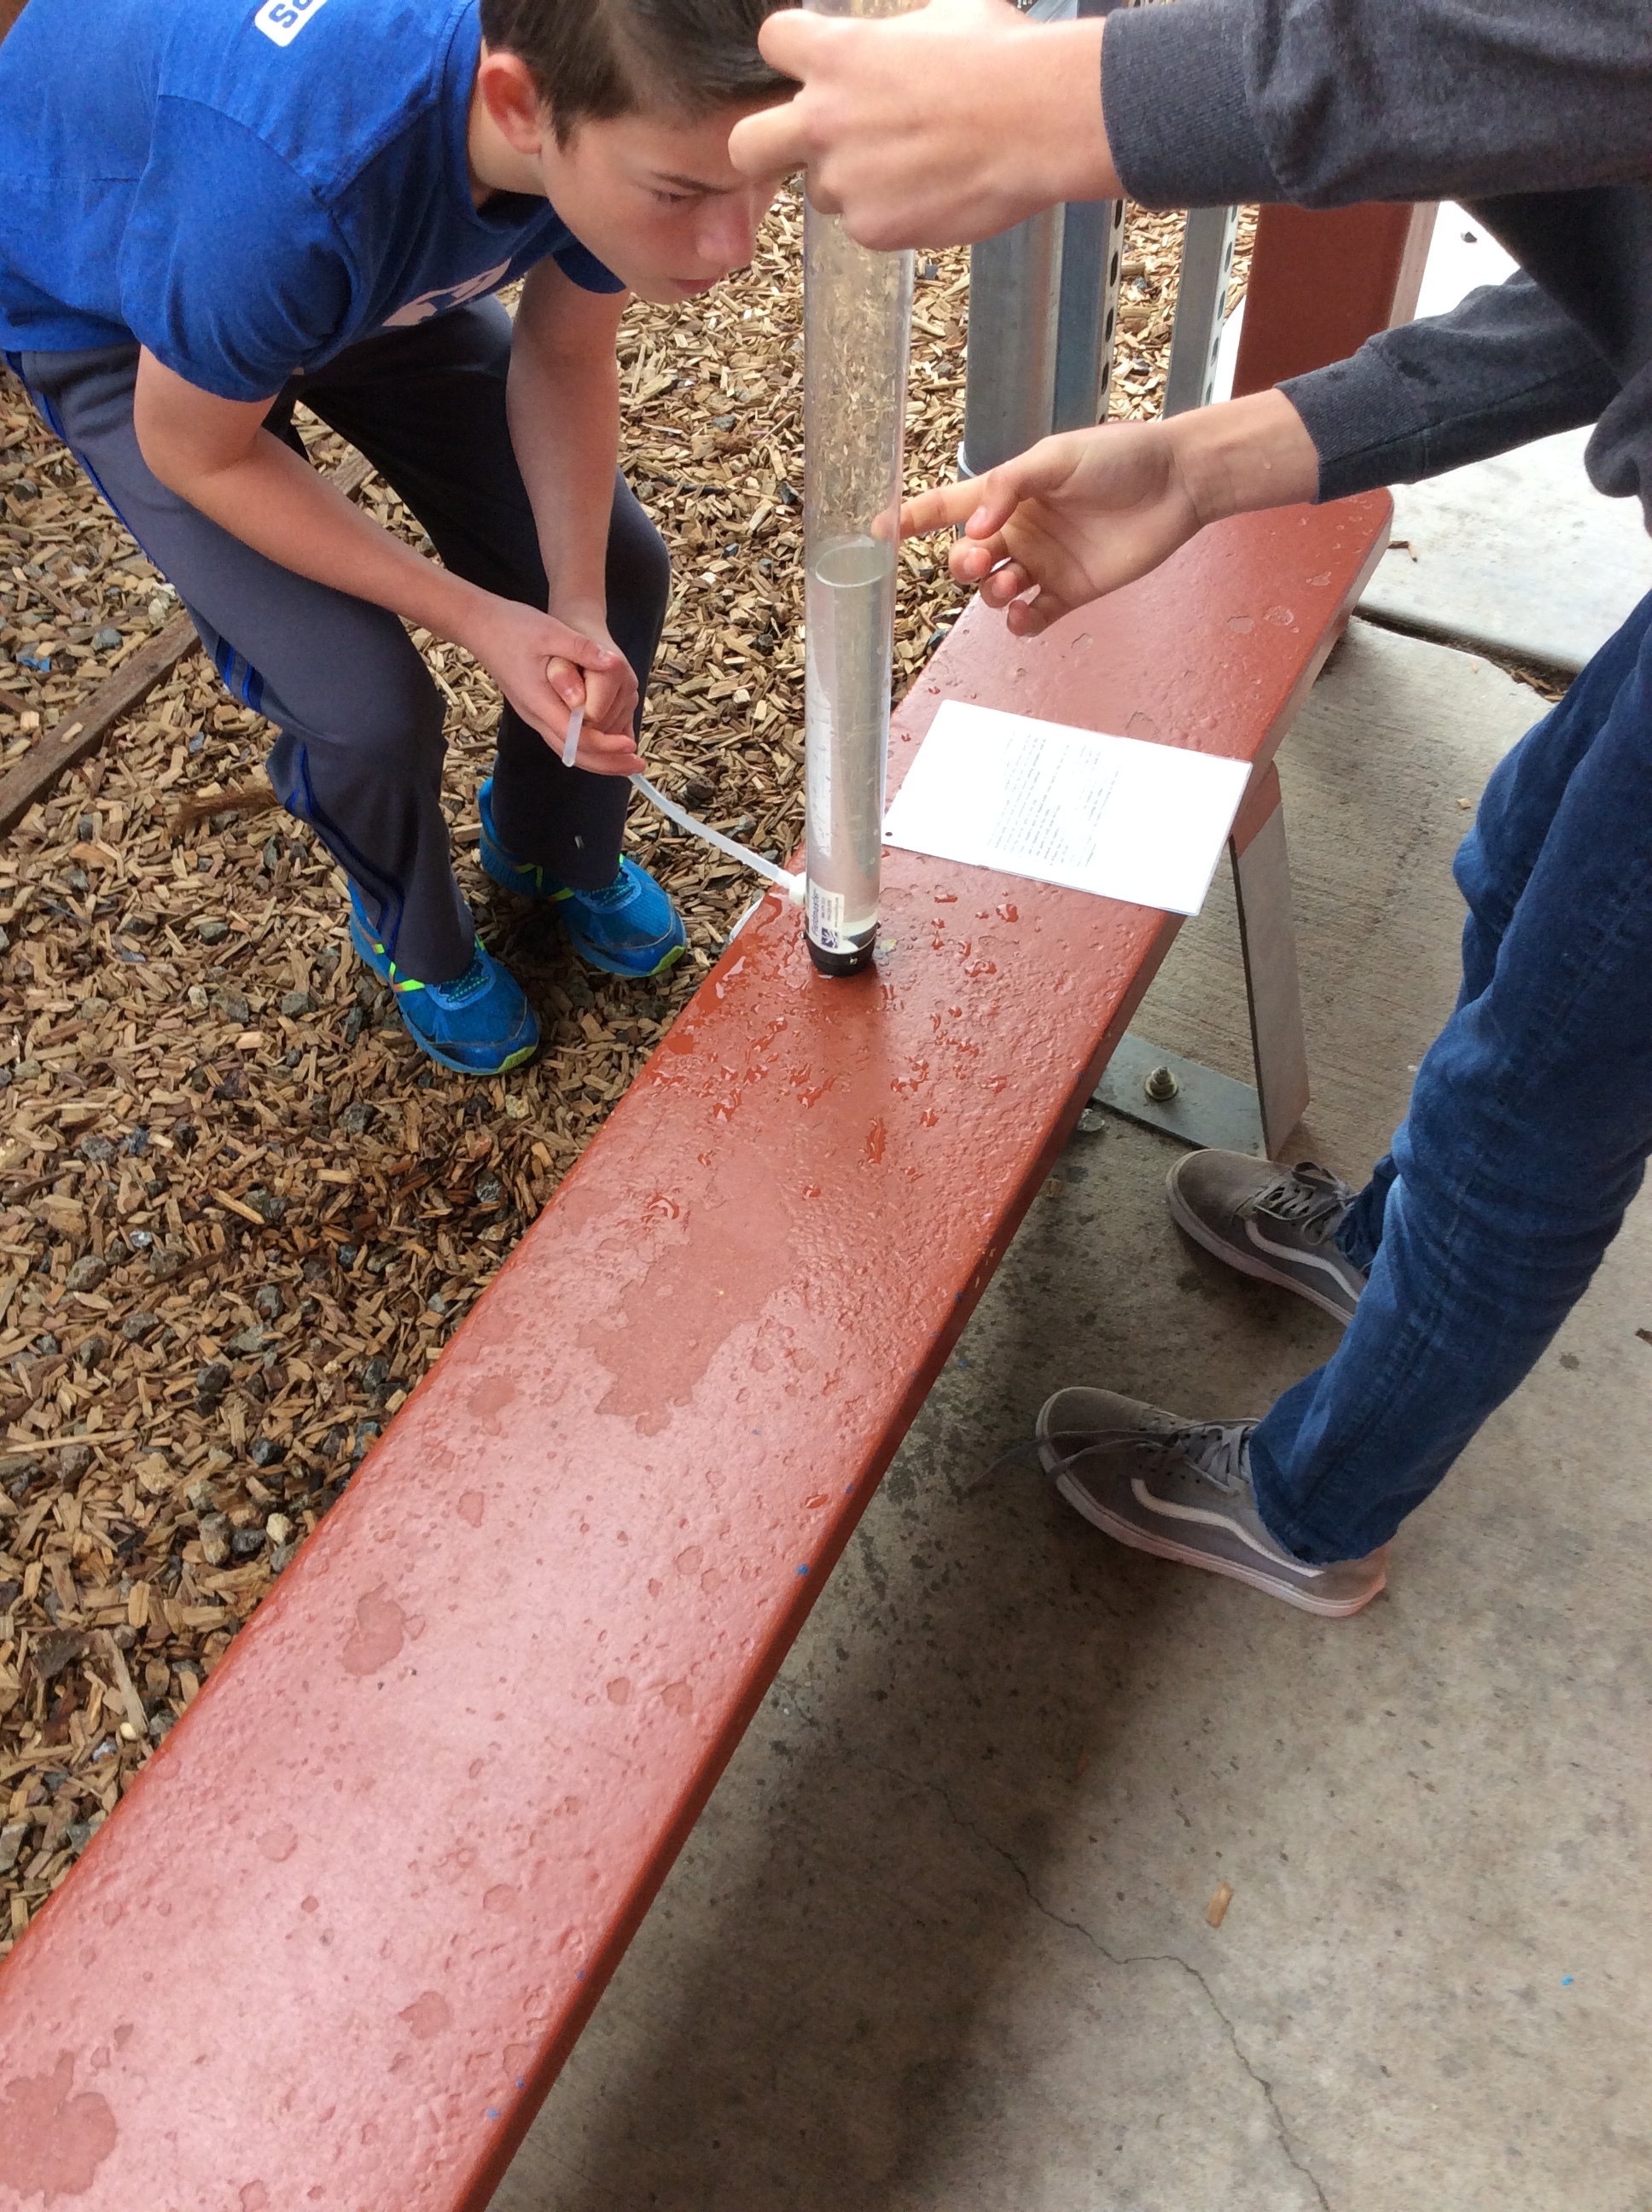
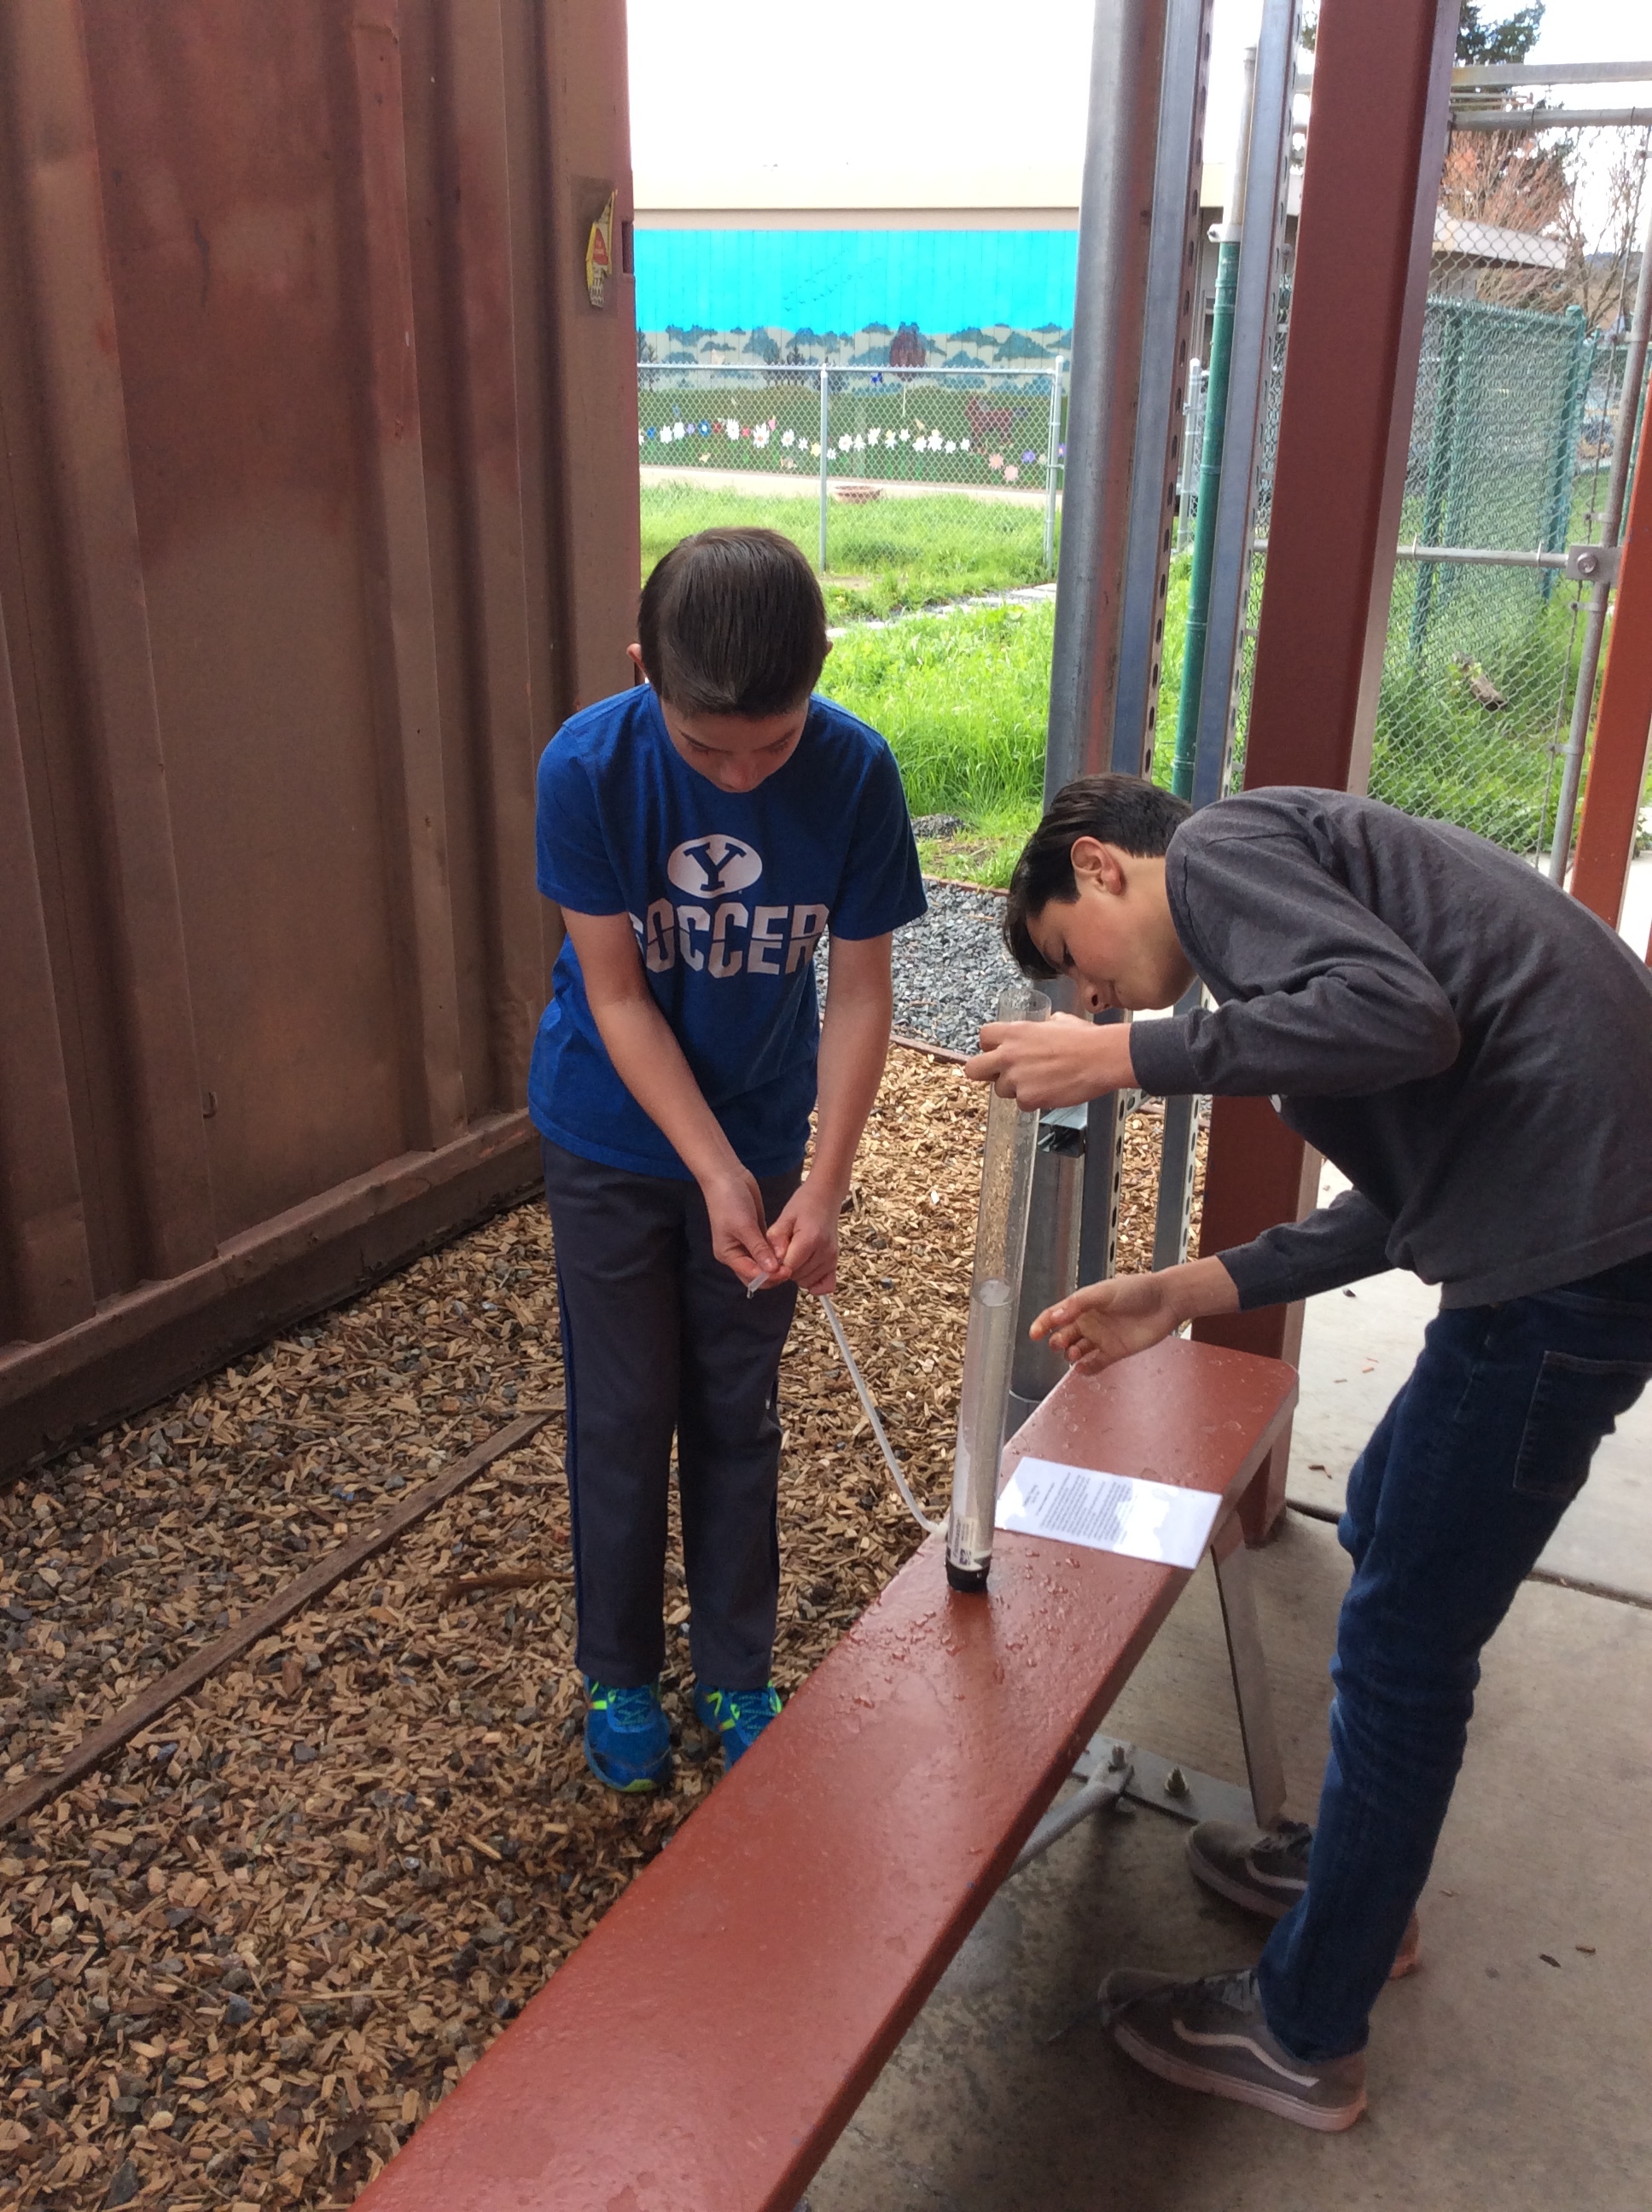
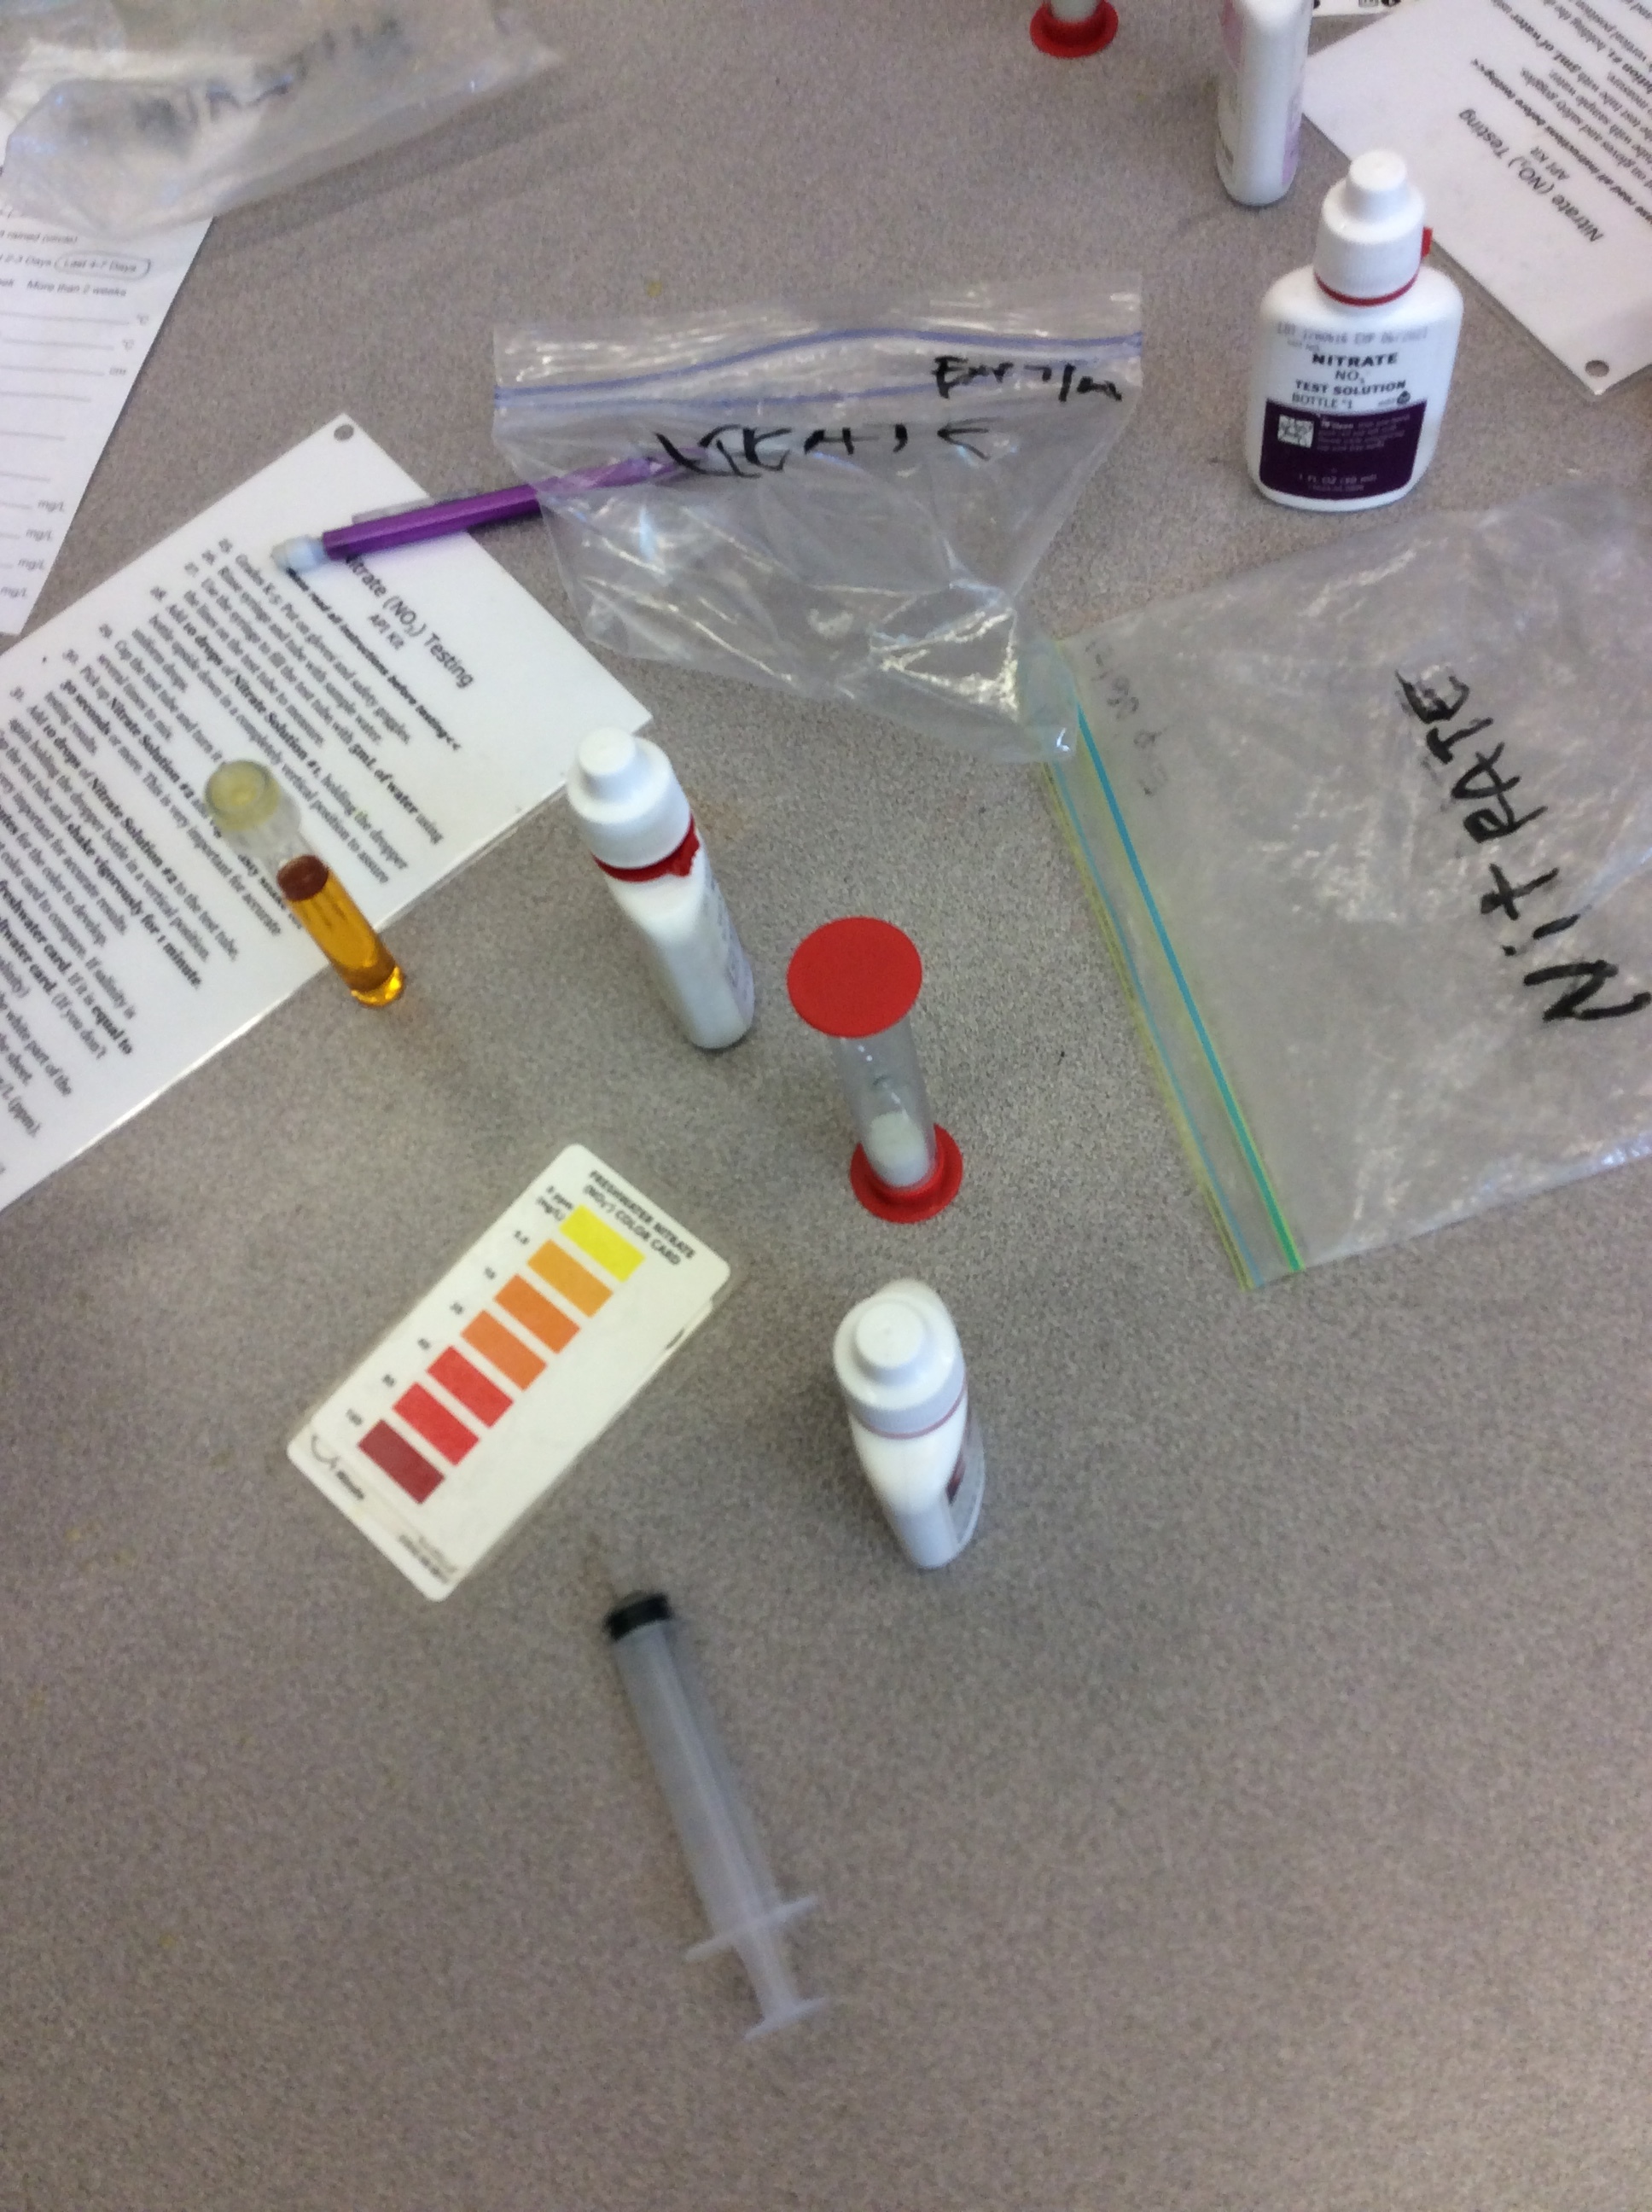
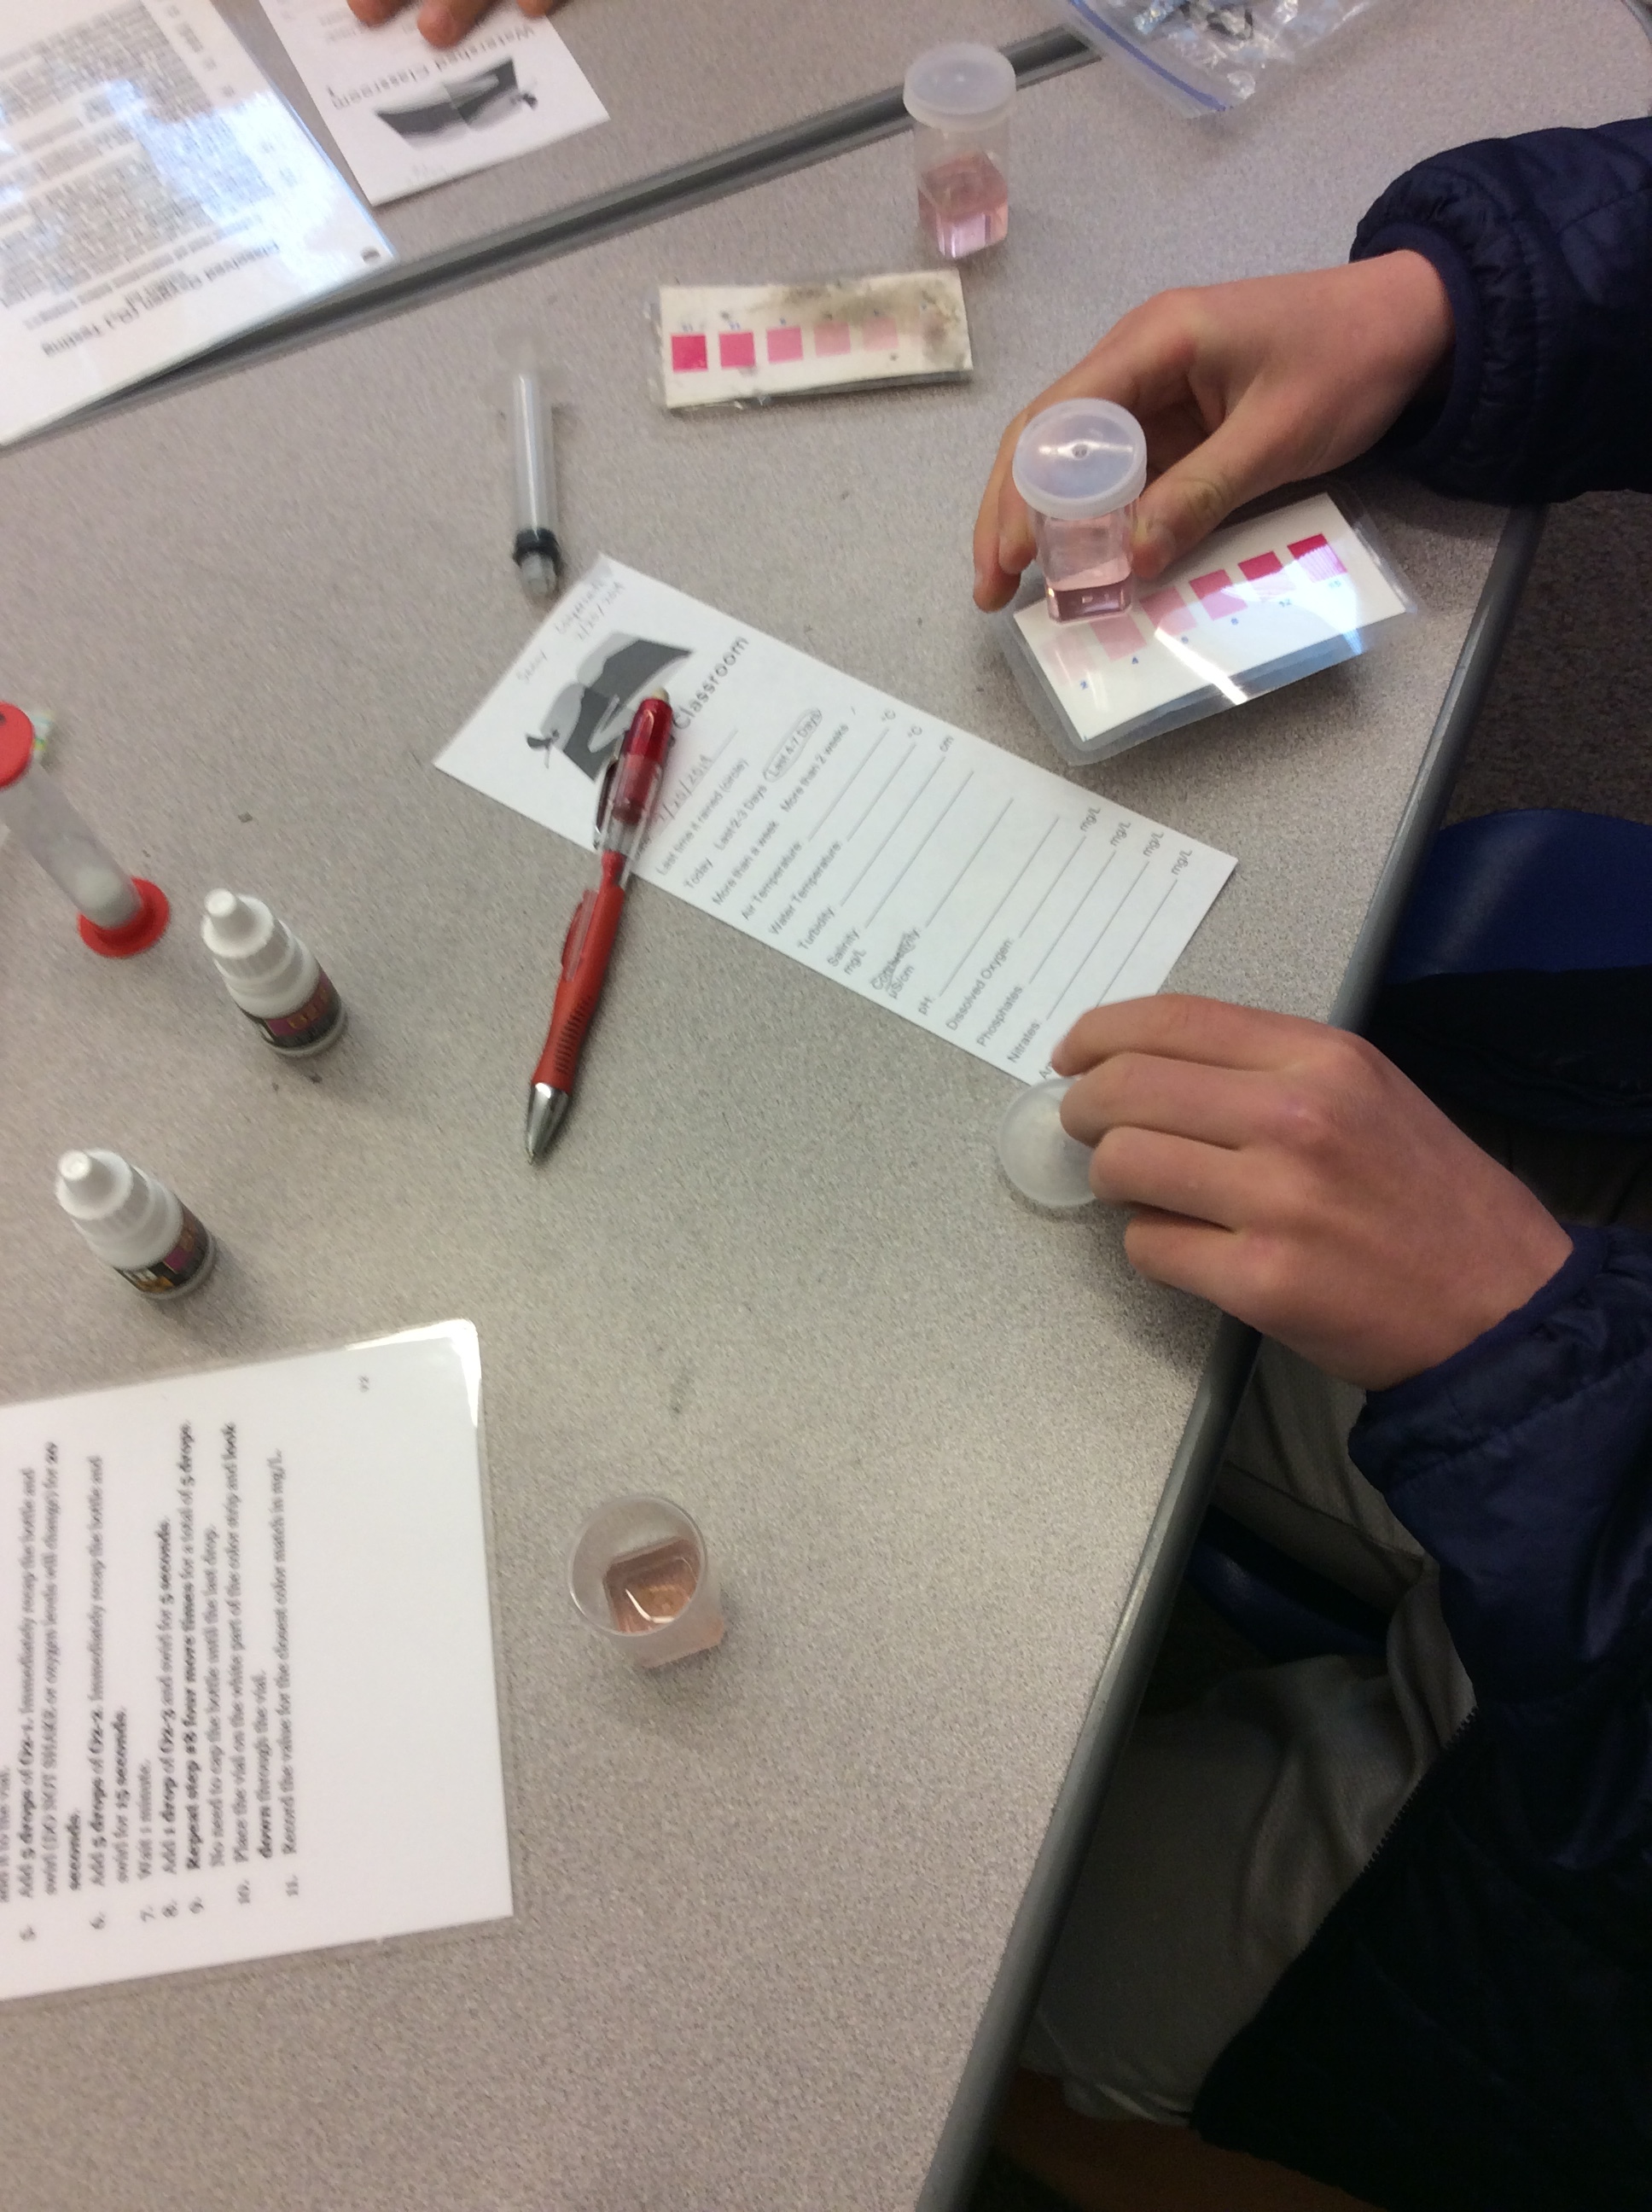
Students get to work, grabbing a small cupful of the water for the chemical tests, returning to their seats to dip testing strips to check for salinity, or adding droplets of ammonia or nitrates then flipping a plastic timer to wait for the color to change. Students testing the turbidity grab larger tubs of water and carry it outside where they carefully pour it into long cylindrical secchi tubes. In pairs they work to slowly release the water through an attached rubber hose at the bottom of the tube, while their partner looks down from the top. The hose is clamped and water level measured when it is possible to see the black and white disc at the bottom of the tube. Students note the water level where they are able to make out the disc.
At many of the tables students begin to comment on minor variations in their results. One student can see the turbidity disc at 30 centimeters, another not until it is only 15 centimeters full; at the chemical tests, slight color variations lead different results. Eventually, with the support of Mr. Jackson, students decide that they will take the results of each table member and use their average. This promoted a lot more discussion, not only around the results, but also about what might lead to these differences and what they might mean. Once the students testing ammonia finish and the class has documented their first results, Mr. Jackson asks everyone to write a plus or minus next to their results, noting whether their measurement indicates a healthy or unhealthy environment.
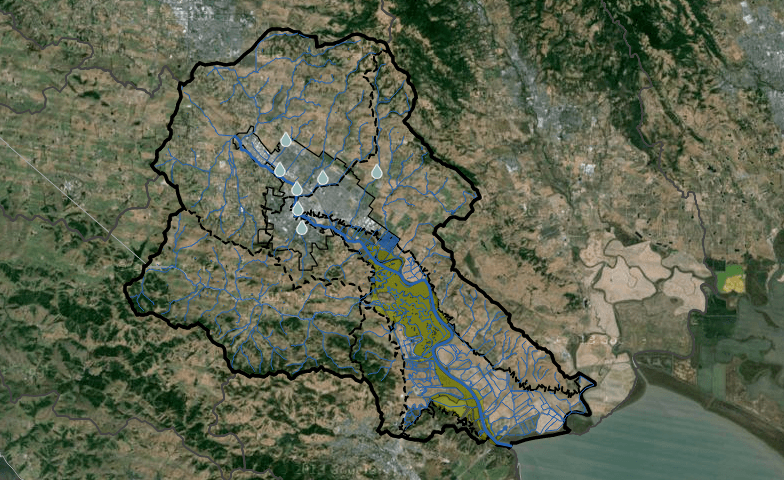
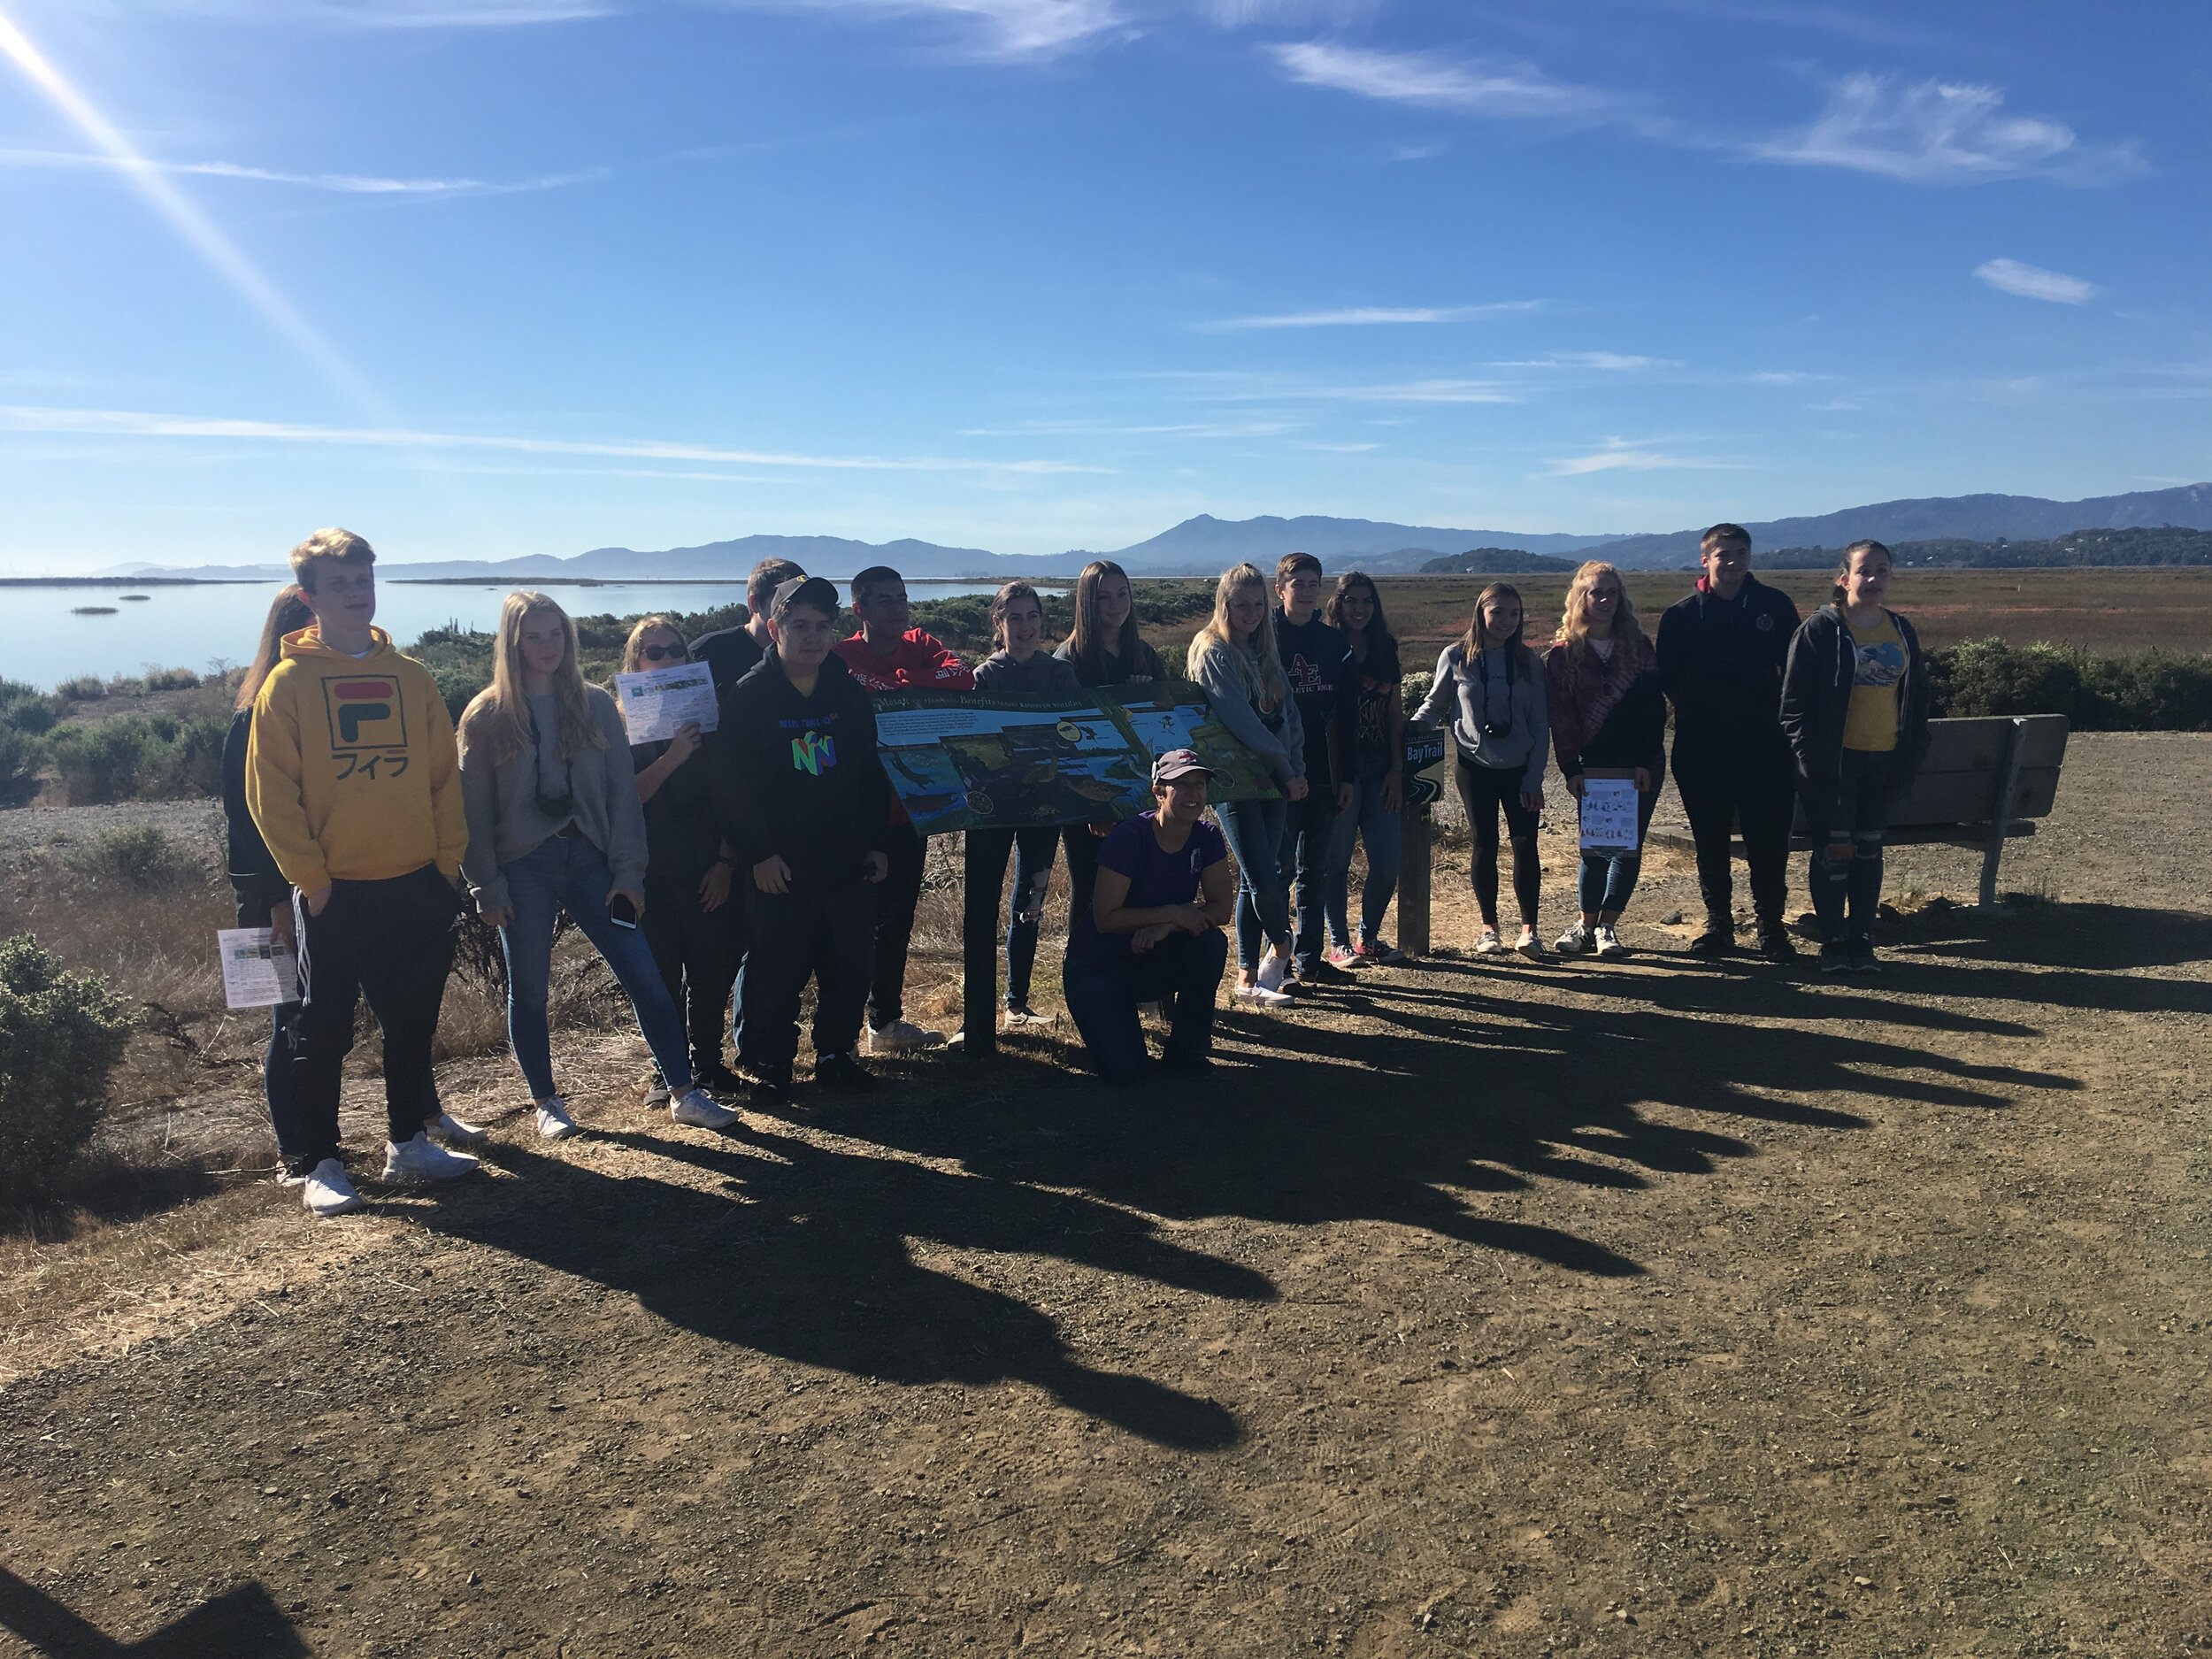
This is the first time students are able to water test, but certainly not the last. Throughout their spring semester Mr. Jackson’s students will test water collected on field trips to nearby creeks and at Steamer Landing. Over the months the class will become very familiar with not only the tests, but also the typical results. This confidence and familiarity helps them to easily identify trends and spot variations in their data. They will begin to understand how and why location and time of day affect their results. The water testing activity extends beyond lessons about which chemicals are present and what levels are healthy; it will lead to lessons about the impact of the tide and how water travels through our watershed. Through this testing, students will develop an in depth understanding of our tidal slough, the components that make a healthy habitat, and that fragility of our environment.